Opening Range and Initial Balance on NQ: How They're Defined and How Traders Use Them
The first hour of RTH draws a box that the rest of the day trades against. What the opening range and the initial balance measure, why the width of the box matters more than its direction, what 5,500 sessions of ES and NQ data say about breakouts, and the two ways traders use the levels.
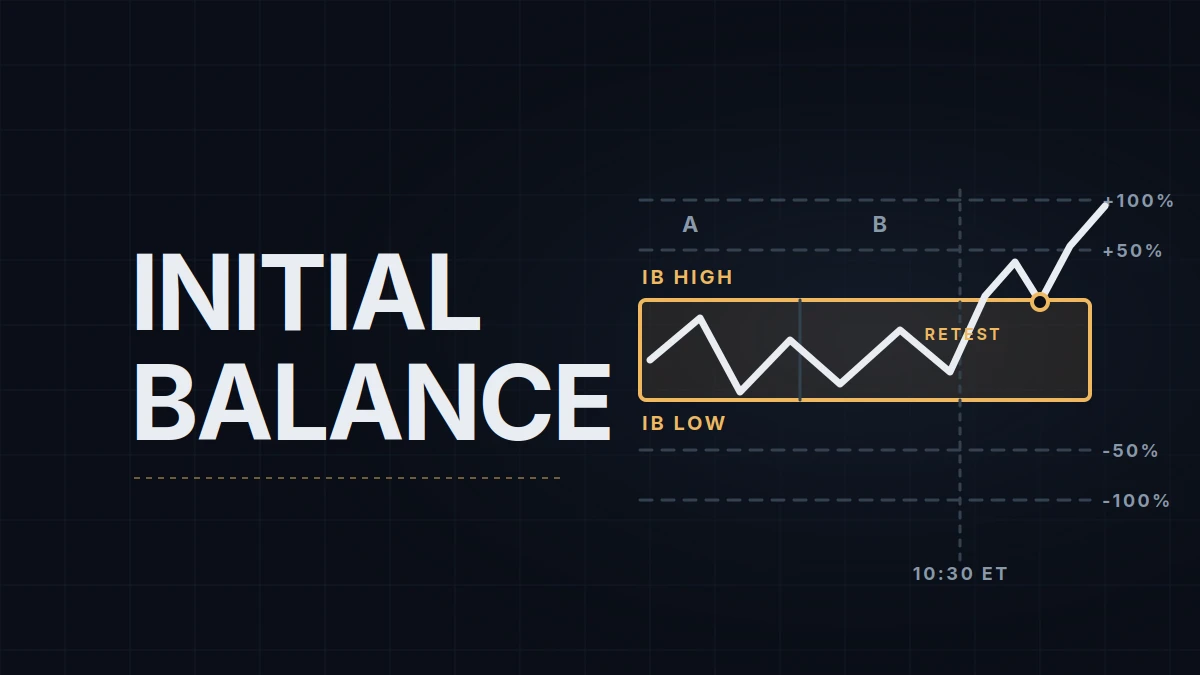
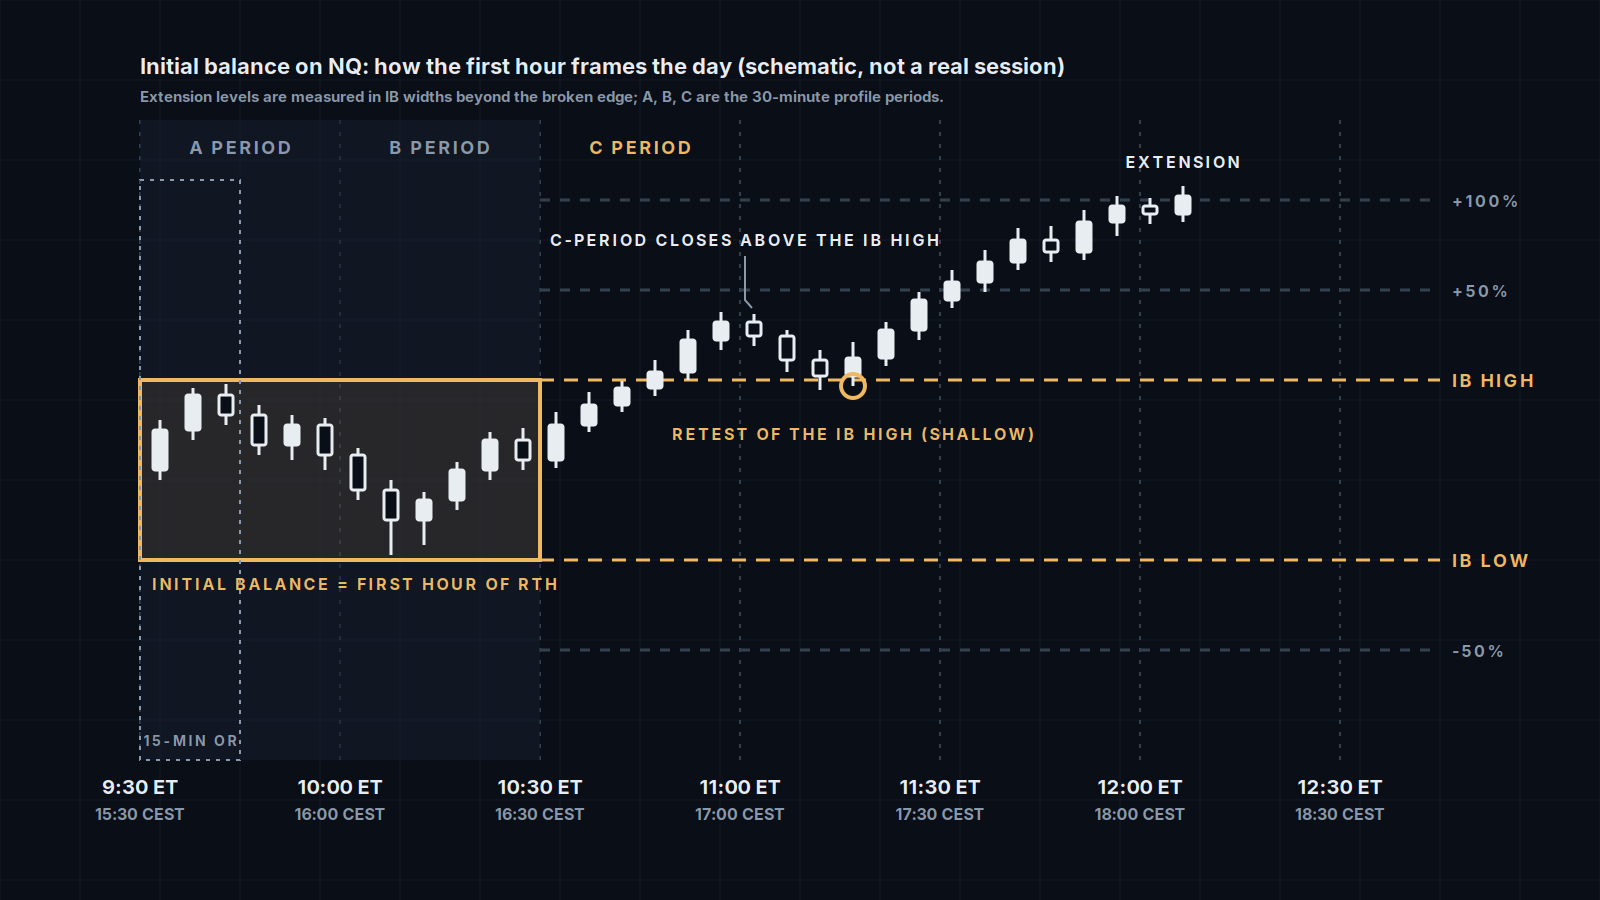
At 9:30 AM ET / 15:30 CEST the cash session opens and for the next sixty minutes the market draws a box. The top of the box is the highest price of that hour, the bottom is the lowest, and in Market Profile language the box is called the initial balance. The opening range is the same idea on a shorter clock: the high and low of the first 5, 15 or 30 minutes. Both are reference ranges, not signals, and most of the day-trading vocabulary around "opening range breakout" and "initial balance trading" comes down to one question: does the rest of the session stay inside the box or leave it?
For what a point and a tick are worth on NQ and MNQ, start with the futures pillar. This post assumes that and adds one range to the key levels you already mark before the open.
Two ranges, one idea
The opening range has no fixed length. Traders use 5, 15 or 30 minutes, and each length trades differently: a 5-minute range is tiny and breaks almost immediately, which is why it is used for early momentum entries; a 30-minute range has already absorbed the first wave of overnight orders and is a more serious boundary. The initial balance is always the first hour, from 9:30 to 10:30 AM ET (15:30 to 16:30 CEST), split into two 30-minute periods that profile traders label A and B. The period that follows, 10:30 to 11:00 AM ET, is the C-period, and it is the one most of the statistics below are about.
What the box measures is agreement. During the first hour, overnight positions get squared, the day's news gets priced and the biggest participants place the orders they had waiting for cash liquidity. The high and low of that hour are the prices where buyers and sellers stopped agreeing. Everything after 10:30 is a test of whether that agreement holds.
What the box tells you about the day
Three things are read off the initial balance once it closes, and they matter in this order.
Width, measured against recent volatility. An IB that is a small fraction of the 14-day average true range (ATR, the average size of a daily bar) means the first hour was compressed and the day still has most of its range to build. An IB that already equals the ATR means the first hour was the day, and the rest is more likely to rotate inside it. Traders who use this classify the IB as narrow, normal or wide relative to ATR before they decide anything else.
Which side formed first. If the high printed early and the low printed late, the market pushed up and gave it back; the data says that day is roughly twice as likely to break down as up. The reverse holds when the low forms first. It is a bias, not a rule.
Where the C-period closes. A 30-minute close outside the box is the classic confirmation. A close back inside after a poke through is the classic failure.
The numbers, from a public dataset
The figures below come from a study published by TradingStats in February 2026 covering 2,686 ES and 2,833 NQ regular sessions from January 2015 through December 2025, with a 60-minute IB and 1-minute bars. They are that dataset's numbers, not mine, and any single year differs from the average.
| What happens after the IB closes | ES | NQ |
|---|---|---|
| At least one side of the IB is broken by the close | 97.8% | 96.2% |
| Both sides broken (double break) | 28.7% | 22.6% |
| Price reaches a full IB width above the high by the close | 18.8% | 12.8% |
| Price reaches a full IB width below the low by the close | 20.5% | 15.9% |
| First break happens in the C-period (10:30–11:00 AM ET) | 65.2% | 63.9% |
| C-period closes above the high, then a full extension up follows | 45.5% | 33.2% |
| First break fails (session closes back inside the IB) | 34.0% | 34.8% |
| Narrow IB (below 0.5× ATR): share of days that break | 98.7% | 98.5% |
| Wide IB (1.0–1.5× ATR): share of days that break | 93.5% | 84.1% |
| Median extension beyond the broken edge, as a share of IB width | 63.6% | 55.6% |
Two of those rows do most of the work. The IB breaks on almost every day, so "will it break" is the wrong question; the useful questions are how far and whether it holds. And on NQ a full extension (one IB width beyond the edge) happens on fewer than one day in six, which is why traders who take the breakout usually manage the trade at 25% and 50% of the IB width rather than waiting for the round number.
Retracement is the other number worth remembering. In the same dataset nearly every NQ breakout came back into the box at some point. When the pullback stayed shallow, under a quarter of the IB width, the day closed in the breakout direction 92% of the time. When the pullback went past the midpoint, only 24% of days closed in the original direction and almost half turned into double breaks. The depth of the first pullback is a better tell than the breakout itself.
Breakout or fade
Practitioners split into two camps and the same box serves both.
The breakout camp enters when the C-period, or a later bar, closes outside the IB, with a stop back inside the box and targets at fractions of the IB width. Their edge lives on narrow-IB days and on days when the retest is shallow. Their cost is the one-in-three first break that fails, which usually fails fast and takes the full stop.
The fade camp treats the IB high and low as resistance and support and looks for a rejection at the edge, especially on a wide IB when the first hour already used up the day's range, or after a failed break has printed. Their edge lives on rotation days. Their cost is the 96% of days on which the edge eventually gives way, which means the fade has to be a reversal at a level, with a defined stop above the wick, not a limit order on the line.
Both camps agree on one thing: the opening range and the IB are context for the trade, not the trade. A breakout on a wide IB with a deep retracement is a different bet from a breakout on a narrow IB with a shallow one, and the numbers say so.
Marking it in NinjaTrader 8
The simplest version needs no indicator. Set the chart's trading hours template to the RTH session, note the high and low at 10:30 AM ET, and draw two horizontal lines or one rectangle; rectangles are easier to read when the extension levels get added. For the ladder, add lines at 0.5 and 1.0 IB widths above and below, which takes one subtraction and two additions. Free opening-range and IB indicators exist in the ecosystem and most let you pick the window length in minutes, so the same tool draws a 15-minute opening range and a 60-minute IB. Whatever draws the lines, check its session setting once: an indicator anchored to the Globex open at 6:00 PM ET instead of the cash open at 9:30 AM draws a box that means nothing.
For me the IB is a European-session afterthought. The cash open lands at 15:30 CEST, late in my window, so I rarely trade the C-period itself. What I do keep is the IB high and low as two more levels on the chart for the next morning: after 10:30 ET they behave like any other level where a lot of people remember what happened, and that is the kind of level my reversal setups work from.