Key Levels on NQ: PDH/PDL, Overnight Range and Volume Profile (POC, VAH, VAL)
A key level is a price where something measurable happened: a session ended, a night's range was set, a day's volume piled up. The seven levels worth marking on NQ before the open, how each is calculated, how to mark them, and how the two schools of level trading use them.
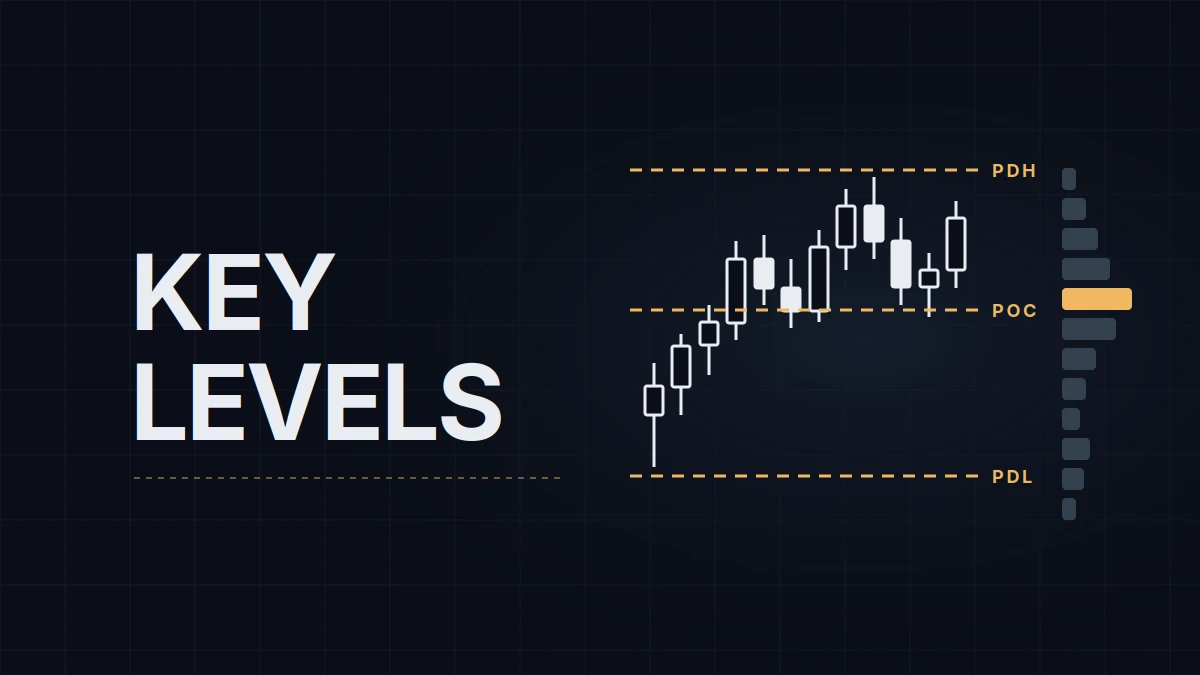
A key level is a price where something measurable happened. The previous session's high is a level because that is where buying stopped for a day. The overnight low is a level because that is where the Globex session found buyers. The point of control is a level because more contracts changed hands there than anywhere else. None of them is a prediction. Each is a record, and price reacts to them because thousands of traders have the same record on their screens and orders resting at the same prices.
This post is about the levels most NQ day traders mark before the open, where each one comes from, and the two ways they get used. It assumes the session clock, because every level is defined against a session, and the chart itself; the mechanics of why price reacts at levels at all has its own post in the General topic.
The prior session: PDH, PDL and the close
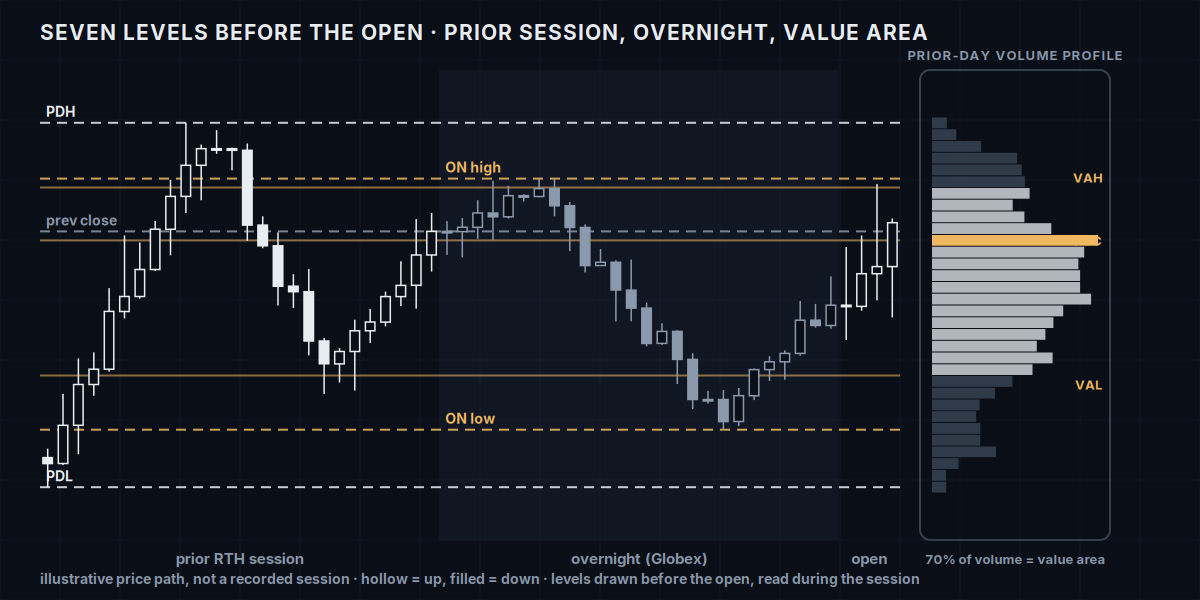
The previous day high (PDH) and previous day low (PDL) are the highest and lowest prices of the prior session, and the previous close (or settlement) is where it ended. Which session decides the numbers. On a chart set to the RTH template, PDH is the high between 9:30 AM and 4:00 PM ET / 15:30–22:00 CEST; on an ETH chart it is the high of the full 23-hour day, which usually includes the overnight and can sit at a different price. Both definitions are in use, and neither is wrong, but a level drawn from one template and read against the other will be off by whatever the overnight added. NinjaTrader takes the definition from the chart's Trading hours setting, which is why that setting matters more than it looks.
The three prior-session levels are the most widely watched because they need no tool: every platform shows yesterday's bar. The close is the quieter of the three and the one that separates a day that opened inside yesterday's range from a day that gapped, which changes how the other levels behave.
The overnight range
The overnight high and overnight low are the extremes of the Globex session before the cash open, from 6:00 PM ET / 00:00 CEST to 9:30 AM ET / 15:30 CEST. The overnight is thinner than the day session, so its range is a picture of where price could go without meeting real size, and the levels it leaves are tested early: a large share of RTH sessions revisit at least one overnight extreme in the first hour. For a trader in European hours the overnight range is the live range of the session, and the overnight high or low being set while you're watching is a different thing from reading it off the chart at 15:00.
Marking it is mechanical: the high and low of the chart between the session boundaries. The only decision is whether "overnight" ends at 9:30 AM ET or at 8:30, when US data releases start moving the market; most traders take 9:30 and note when a data release set the extreme.
Volume profile: POC, VAH and VAL
A volume profile is a histogram of traded volume by price, drawn sideways on the chart, for a chosen period, usually the prior session. The point of control (POC) is the price with the most volume. The value area is the range of prices around the POC that contains 70% of the period's volume; its top is the value area high (VAH) and its bottom the value area low (VAL). The 70% figure is a convention, one standard deviation of a normal distribution, and it's what every platform uses by default.
These three levels say something the session extremes don't: where the market accepted price, meaning traded there at length, versus where it only visited. A wide value area is a day of two-sided trade; a narrow one with long tails is a trend day that spent most of its volume in one place. The POC from a prior day that price has not returned to is sometimes called a naked POC, and it is on many watchlists precisely because untested volume nodes tend to get revisited. Profiles can also be built over several days (a composite), which produces levels that carry more weight and move more slowly.
Getting the profile requires a tool. TradingView's session or fixed-range volume profile draws it on any chart; NinjaTrader has volume profile in its Order Flow+ package and in a number of third-party indicators. The numbers differ slightly between tools, because tick data and value-area rounding differ; a level is a zone a few ticks wide, not a single price.
Marking the seven in ten minutes
Before the open, on a 15-minute or hourly chart with the right session template: draw PDH, PDL and the previous close from yesterday's bar; draw the overnight high and low from the Globex bars since 6:00 PM ET; read POC, VAH and VAL from yesterday's profile and draw them. Note which of the seven sit within a few points of each other; two levels at the same price are one level that matters more. Note where price is opening relative to the value area and to yesterday's range, since the same level plays differently as support from above and as a target from below. Then leave them alone: levels are drawn before the session and read during it, not redrawn as the session unfolds.
The chart these get drawn on and the chart they get traded from are usually different, and that's fine: a level is a price, and it is the same price on a 5-minute chart and a range chart. An indicator can draw part of the set: WotT Session Key Levels, free on this site, puts the prior RTH session's high and low and an estimate of its POC and value area on any intraday NinjaTrader 8 chart, but not the previous close or the overnight range.
Some traders add a set of levels from the options market to the same chart: the call wall, the put wall and the gamma flip, converted from QQQ or NDX strikes. They are recalculated every morning and come out of a model rather than out of traded prices, so they get a line style of their own; the gamma levels post covers where to get them and how to draw them.
The two ways traders use them
The first school trades the reversal: price comes into a level, shows rejection (a wick, a failed push, a shift in order flow), and the trade is against the move that brought price there, with the stop beyond the level. The bet is that the level holds. The cost is that levels break, and a reversal trader is short at the high of a day that becomes a trend day, which is why the stop and the definition of "rejection" carry the whole strategy.
The second school trades the breakout: price reaches a level, trades through it, and holds beyond it, and the trade is in the direction of the break with the stop back inside the level. The bet is acceptance. The cost is false breakouts, the wick that pokes through a level and comes back, which is exactly the reversal trader's entry; the two schools are trading opposite sides of the same moment, and the winner is decided by whether price accepts beyond the level or rejects it.
Most traders end up with a rule for which mode a level gets on which day: trend days favor breaks and range days favor fades, and the opening position relative to the value area is one common way to decide. What no school does is trade every level; the seven produce more touches per day than any plan can take, so most of the work is choosing which ones to trade.
I mark the levels before the session from a time chart, mostly with the volume profile from Order Flow+ in NinjaTrader, and trade the reversal side: the setup is rejection at a level I drew before the open, on a chart with little else on it. That is a preference with a known cost; on trend days the breakout school gets the better trades.
Educational content, not investment advice. Futures trading involves substantial risk of loss. Examples are for illustration only. Read the full Risk Disclosure.