NinjaTrader's MAE/MFE Export Is Wrong: The Bug and Three Workarounds
MAE and MFE are the two numbers that tell you whether your stops and targets are in the right place, and on live accounts NinjaTrader 8 has been getting them wrong since 2023. What the columns mean, how to spot the bug in your own export, and three ways to get clean numbers.
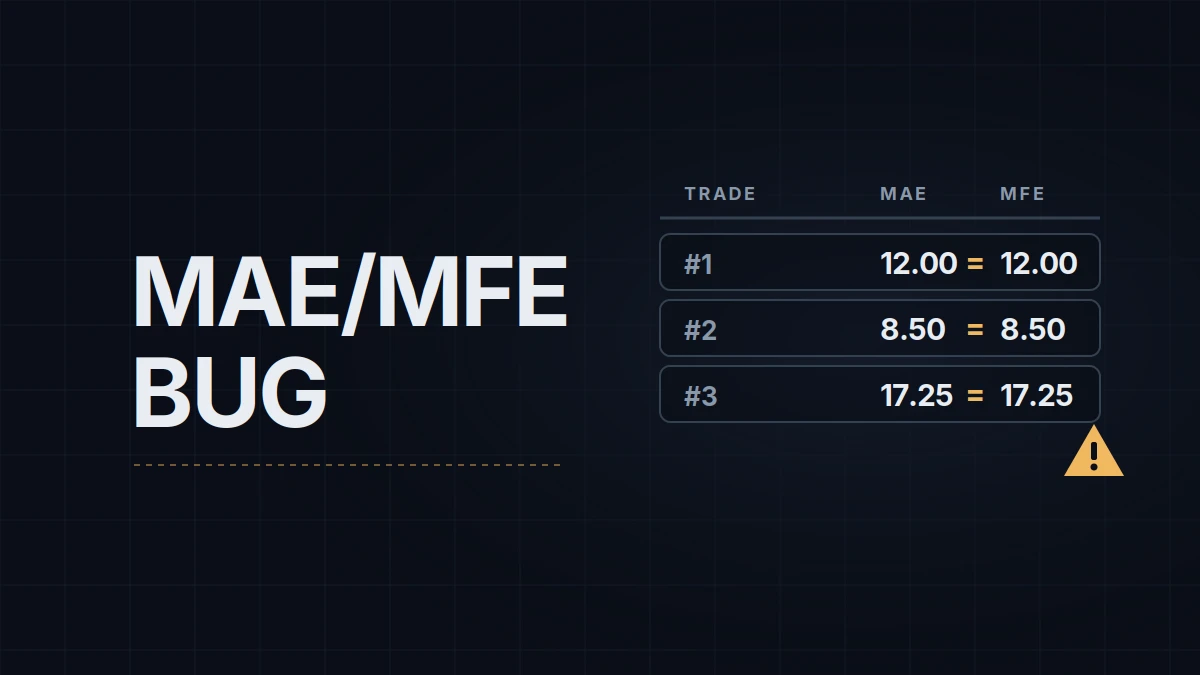
A trade goes 22 points against you, turns, runs 32 points in your favor and closes at plus 12. NinjaTrader's Trade Performance window reports the same trade with an MAE of 12 and an MFE of 12. Both numbers are wrong, and they are wrong in a way that quietly ruins the one analysis those columns exist for.
This is a known problem. Traders reported it on the NinjaTrader forum in 2023 for live and broker accounts, support reproduced it, acknowledged it as a limitation "to be corrected in a future release", and at the time of writing the threads are still open on 8.1.x builds. The Sim101 account is usually not affected, which is part of why it went unnoticed by so many people: the numbers look fine in practice sessions and go wrong once real money is on the line. If your journal, spreadsheet or stop-placement rules are built on MAE/MFE exported from a live account, the rest of this post is about how to find out whether you've been working with bad data and what to do instead.
What MAE and MFE measure
MAE, maximum adverse excursion, is the furthest a trade went against you between entry and exit, measured from the entry price. MFE, maximum favorable excursion, is the furthest it went in your favor. A trade that dropped 22 points, rose 32 and closed at plus 12 has an MAE of 22, an MFE of 32 and a result of 12. NinjaTrader shows both in the Trade Performance window (Trades tab, in ticks, points or currency depending on the Display setting) and includes them in the CSV export from that window.
The two columns answer questions nothing else in the report answers. The distribution of MAE on your winning trades tells you how much room a good entry needs before it works, which is the sound way to size a stop; if 90% of winners never went more than 15 points against you, a 40-point stop is paying for cover you don't use, and a 10-point stop is cutting winners. The distribution of MFE on your losers tells you how much open profit you routinely give back, which is the argument for or against partial exits. None of that can be done from P&L alone, and all of it collapses when MAE equals MFE on every row.
What the bug looks like
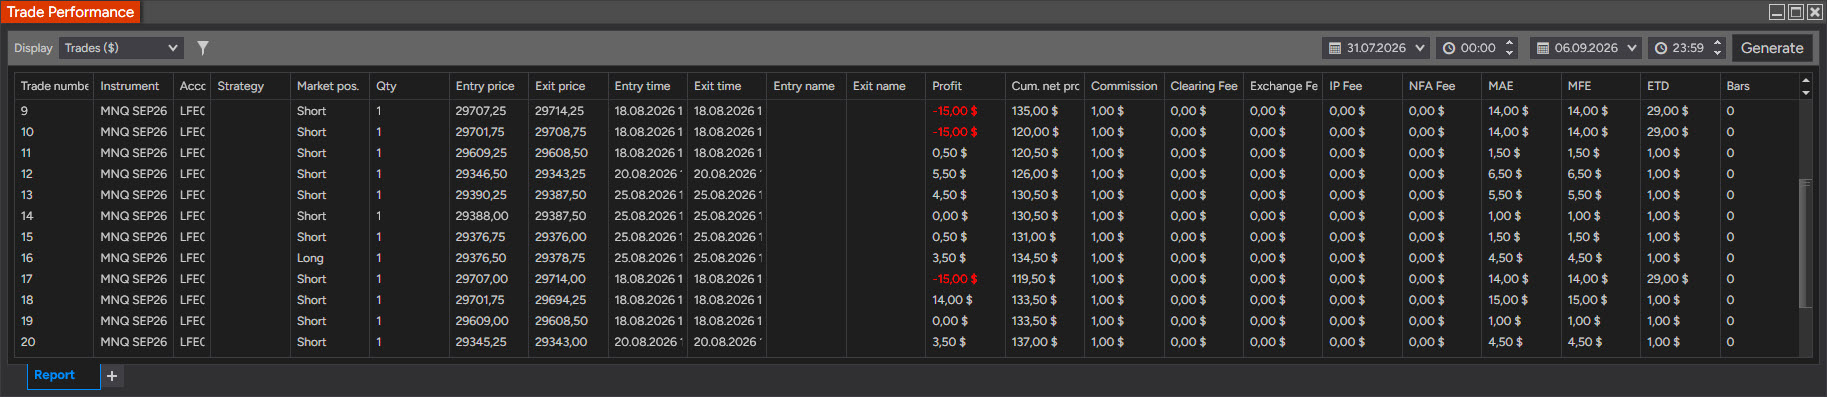
The pattern reported on the forum, and the one to look for in your own data, is MAE and MFE showing the same value on trades where that's impossible. A trade can legitimately have MAE equal to MFE only if price moved the same distance both ways, which happens rarely; a whole column of equal pairs is the bug. In some reports the shared value is the closed result itself, in others it's an unrelated number. Two other symptoms show up in the same threads: MAE or MFE far larger than the trade's bar range, and values off by a tick from what the chart shows, which is a separate, older rounding issue.
Three things about how NinjaTrader computes these numbers explain the shape of the problem. The values are recorded live, from the bid/ask stream while the position is open, not reconstructed afterward from bar data; a disconnect during a trade leaves a gap, and a reconnect can leave the pair at whatever was last written. They are computed per NinjaTrader "trade", which is an entry matched with an exit, so an ATM with two targets reports one position as two trades with two MAE/MFE pairs. And the display unit is a setting: a number that looks wrong in points may be right in ticks, so the first check is the Display dropdown.
How to check yours
Open Trade Performance, set the Display to points, pick a week of live trades, and compare five of them against the chart. Right-click a trade and open its chart, or use your own chart with the entry and exit times: the lowest point between entry and exit (for a long) is the MAE, the highest is the MFE. If the report matches the chart within a tick, your installation is fine and the rest of this post is a precaution. If MAE equals MFE on trades where the chart shows two different excursions, every historical MAE/MFE number in that account is suspect, and it's worth checking whether the Sim101 account on the same machine shows correct values, which is the fingerprint of this particular bug.
Three workarounds
Read it from the chart. After the session, open each trade on a chart with the entry and exit marked and read the two extremes by hand into your journal. On a tick or range chart the extremes are unambiguous, and the whole session takes ten minutes for a handful of trades. The cost is that it's manual, and manual data gets skipped on bad days, which are the days that matter most for the MAE distribution.
Read it from a recording. If you record your sessions (OBS, Camtasia, any screen recorder), the recording has every tick the platform showed you, disconnects included, and reviewing the trade on video gives the excursions along with the context: what price was doing when the trade sat at its worst point. The cost is disk space and review time, and the benefit goes well beyond MAE/MFE, which is why session recording has a post of its own in this topic.
Compute it from data outside Trade Performance. The bug is in the report, not in the platform's data. A small NinjaScript indicator that tracks the open position and records its extremes from the chart's bars, or an external journal that recalculates MAE/MFE from entry time, exit time and historical bars, produces numbers that don't depend on the live bid/ask recording at all. The cost is that someone has to build it; the benefit is that it's automatic and consistent, and it works retroactively on old trades because bar history is available where the live stream wasn't.
Whichever route, the rule that makes the numbers usable is to record MAE and MFE in the same unit, from the same source, for every trade, including the ones that were closed by hand at breakeven in a hurry. Leave out the boring trades and the distribution describes only the memorable ones.
My journal takes MAE and MFE per position as two fields entered after the session, from the recording, and the platform's export is used for fills and times only. The excursion numbers are the ones I calibrate stop distance against, which is why they get the slow path rather than the one-click one.
Educational content, not investment advice. Futures trading involves substantial risk of loss. Examples are for illustration only. Read the full Risk Disclosure.