NinjaTrader 8 Chart Setup: Data Series, Bar Types and Workspaces
The from-zero guide to charts in NinjaTrader 8: what a minute, tick, range, volume or Renko bar actually measures, the four Data Series settings that change what you see, the chart properties worth touching, and how templates and workspaces keep you from rebuilding it all tomorrow.
Every chart in NinjaTrader 8 comes down to three decisions: what one bar measures, which slice of the day it loads, and how you save the result so it's there tomorrow. All three live in two windows, Data Series and Properties, and most "my chart looks wrong" questions on the NinjaTrader forums are one of those settings left at its default. This is the NinjaTrader chart setup post the rest of the Platform & Tools topic points back to; it assumes the platform is installed and connected to a data feed (if it isn't, connecting NinjaTrader 8 to a Lucid account via Tradovate walks that part).
Opening a chart and the Data Series window
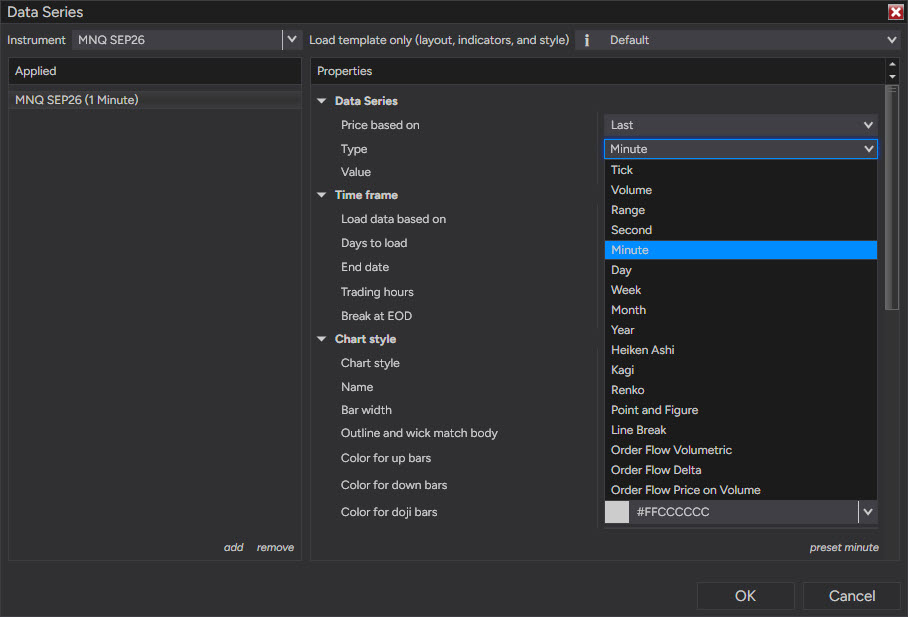
Control Center → New → Chart opens the Data Series window before any chart exists. Pick the instrument on the left (the front-month contract, MNQ 09-26 at the time of writing, or the continuous MNQ ##-## if you want the platform to handle the quarterly rollover for you), and the panel on the right lists everything that decides what the chart shows. On an existing chart the same window is one right-click away: Data Series. Everything below lives there or in Properties.
What one bar measures
The Type and Value fields together define a bar. A "5 Minute" chart closes a bar every five minutes whether one contract traded or ten thousand; a "2000 Tick" chart closes a bar every 2,000 trades whether that took four seconds or four minutes. Same market, different clock.
| Type | One bar closes when… | Value means | Where it fits |
|---|---|---|---|
| Minute / Second / Day | the clock says so | minutes, seconds or days per bar | the default; comparable with every other chart on the internet; structure on 15-minute and hourly |
| Tick | N trades have printed | trades per bar | activity-based; bars come fast when the market is busy and slow when it's dead |
| Volume | N contracts have traded | contracts per bar | like tick, but weighted by size; one 50-lot moves it more than fifty 1-lots |
| Range | price has spanned N ticks | bar height in ticks | fixed-size bars regardless of time or volume; every bar the same height |
| Renko | price has moved N ticks in one direction | brick size in ticks | filters noise, but the open drawn on each brick is often not a traded price |
| Heiken Ashi, Kagi, Line Break, Point & Figure | their own smoothing rules | varies | derived charts; the candles no longer show the real open and close |
Two details hide in that table. Range and tick values are in ticks, and one tick on NQ or MNQ is 0.25 index points, so a "Range 30" bar is 7.5 points tall and a "Range 100" bar is 25 points (why a tick and a point aren't the same thing). And tick, volume and range bars are built from tick-level history, so the first load downloads far more data than a minute chart, and how far back you can scroll depends on the data feed. Setting Days to load to a week instead of the default keeps those charts fast.
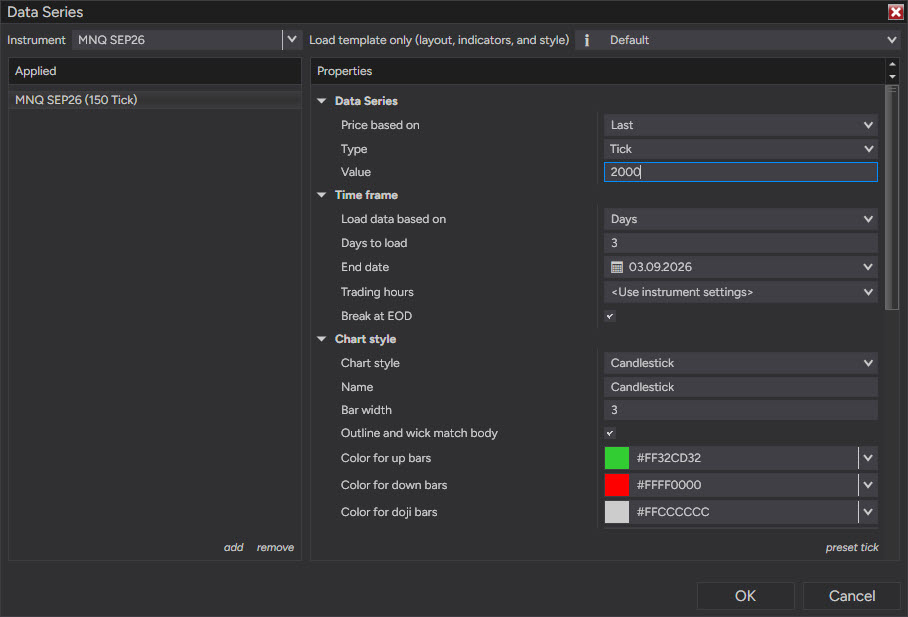
The Chart style field below Type (Candlestick, OHLC, Line on close, Box and a few more) changes only how a bar is drawn, not what it measures; how to read a price chart covers what each of those drawings shows.
Four Data Series settings that change what you see
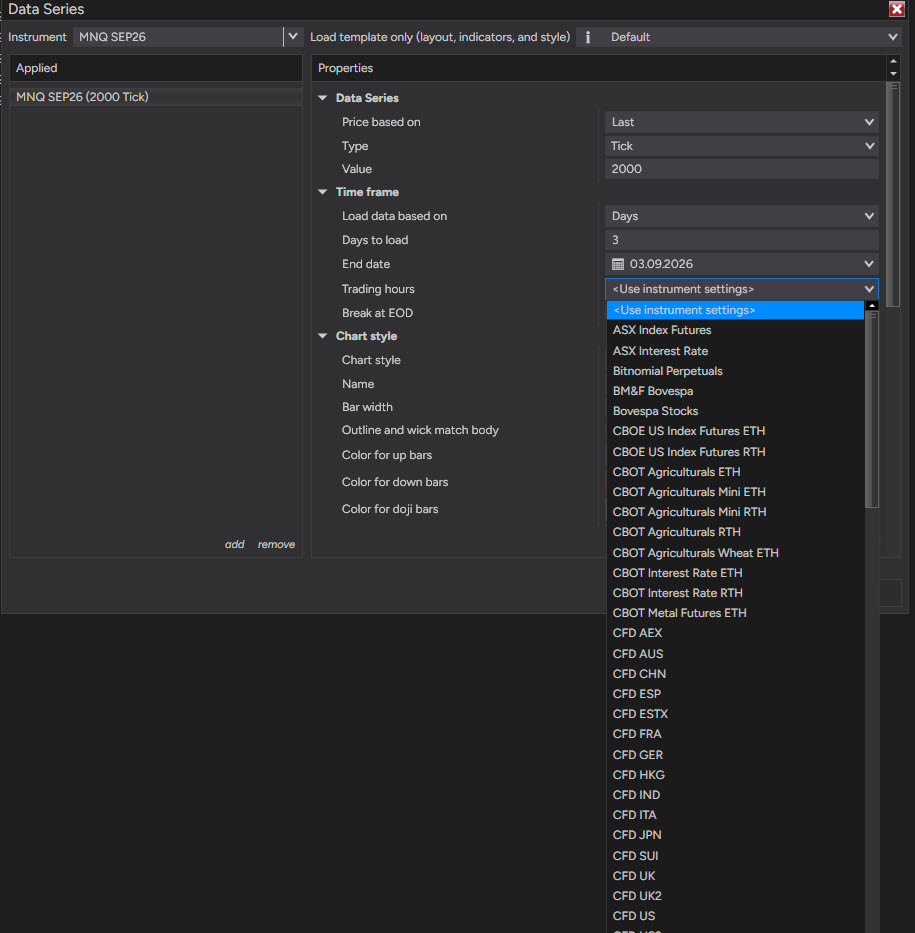
Trading hours. This dropdown decides which hours the chart considers part of the day. CME US Index Futures ETH loads the whole 23-hour session (6:00 PM ET / 00:00 CEST to 5:00 PM ET / 23:00 CEST the next day); CME US Index Futures RTH loads only 9:30 AM–4:00 PM ET / 15:30–22:00 CEST. It changes more than the bars on screen: session highs and lows, VWAP, opening range, "today's" volume and any indicator that resets daily all reset on the boundary of this template. If you trade the European hours, an RTH chart is empty until 15:30 CEST; the NQ sessions post has the full clock.
Load data based on / Days to load. Days, bars or a custom date range. Ten days is plenty for an execution chart; a 15-minute structure chart wants 30 or more so the swing highs and lows from last month are still on screen.
Break at EOD. When on, the platform forces a bar to close at the end of the trading day defined by the template, even if a tick, range or volume bar was mid-build. Leave it on unless you specifically want bars to span the session boundary.
Tick Replay. Off by default and it should stay off unless an indicator's documentation asks for it. It rebuilds intrabar tick history for indicators that need per-tick data (order-flow tools, some volume indicators) at a real cost in load time and memory.
Properties: the visual settings worth touching
Right-click → Properties is the other window. Most of it is cosmetic; a handful of settings aren't.
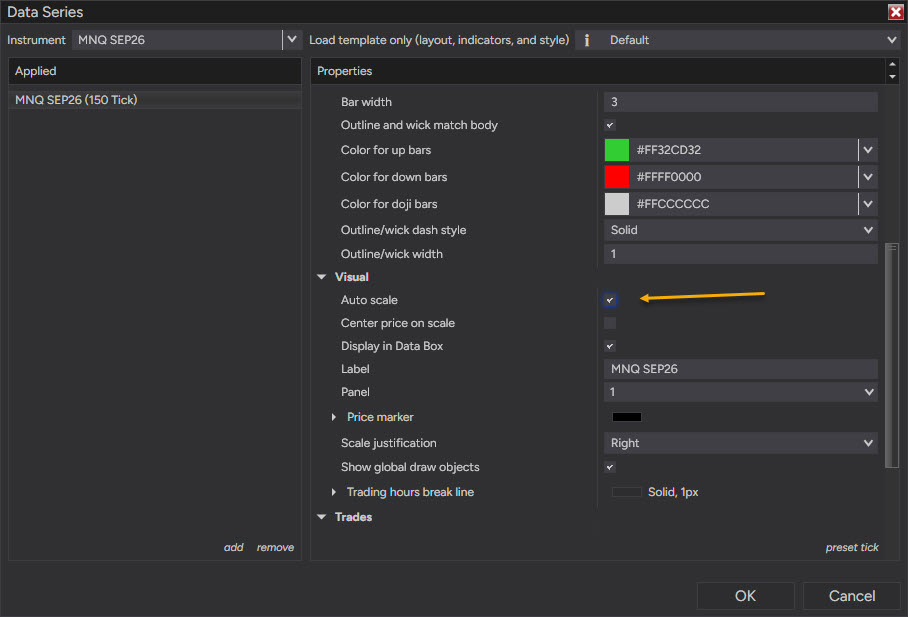
Auto scale (this one sits in the Data Series window, under Visual, rather than in Properties) keeps the visible bars fitted to the panel; turn it off and the price axis stays put while you scroll, which is what you want when you're watching a level that's currently off-screen. Right side margin is the empty space after the last bar, where drawn levels and pending orders need room to be read. Equidistant bar spacing matters on tick and range charts, where bars don't arrive on a schedule; with it off, quiet periods compress and busy ones stretch, which shows time in a way those bar types otherwise hide. Bar width and spacing decide how many bars fit in the panel; on a fast chart, narrower bars and more of them.
Colors are the rest of the window: background, grid, axis, crosshair, up and down bars. Change them once and save them (next section).
Templates and workspaces: build it once
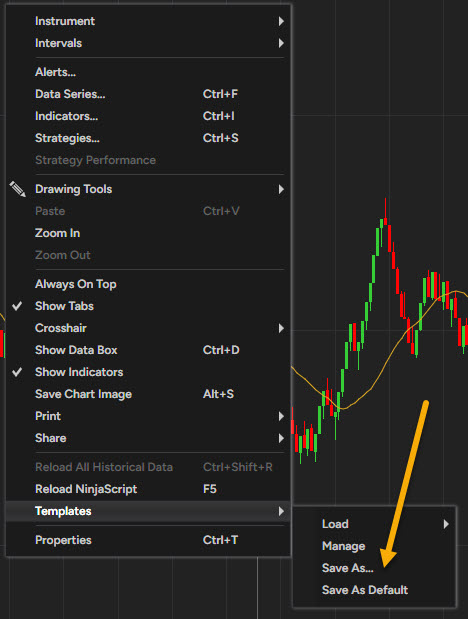
A chart template saves one chart's setup: the data series settings, indicators and chart properties, but not the drawings on it. Right-click → Templates → Save As, name it, and any new chart can load it with Templates → Load. Templates → Save As Default makes the current chart the starting point for every new chart, which is the single most useful thing in this post if you keep changing the same five settings.
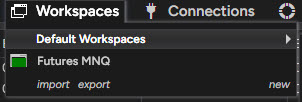
A workspace saves the whole screen: every open window, its size and position, and the links between them. Control Center → Workspaces → Save As. The platform reopens the workspaces that were open when it closed, and it asks before discarding unsaved changes, so save after any layout change you intend to keep.
The link icon in the top-right corner of each window connects windows by color: change the instrument in one linked chart and every window with the same link color follows. Two charts and a Chart Trader on the same link is a normal execution setup. Link colors, interval links, tabs and several workspaces across two or three monitors are covered in workspaces and instrument linking.
Three layouts to start from
Three layouts cover most of the ground:
Indicators on a minute chart. A 5-minute ETH chart with a moving average, VWAP and volume. The layout most people start with, fine for learning to read a session; the failure mode is adding a sixth indicator instead of understanding the first.
Structure chart plus execution chart. A 15-minute or hourly chart on the left for swing highs, lows and the levels you mark before the session, and a fast chart on the right (a 1-minute, a 500-tick, a small range bar) to time entries at those levels. Linked by instrument. This is the layout most level-based methods end up on.
Bare tick and range charts. Nothing on the chart but price and the levels drawn by hand: a range chart for execution, a larger tick chart for context, structure read from a separate timeframe. This is what I run, give or take one moving average, with order flow in a separate Bookmap window rather than as chart indicators, because the decision at a level is whether price rejects it, and every plot I've tried answered a different question. It's a preference, not a recommendation; the second layout is the better starting point for most people.
Four things that go wrong
"Data is delayed" in the corner. A data permission problem, not a chart setting; the fix is on the connection side and is covered at the end of the Lucid connection post.
The tick chart never finishes loading. Days to load is too high for a tick series. Set it to 5–10 days and reload.
The chart is empty during European hours. The Trading hours template is RTH. Switch the data series to ETH.
A friend's 5-minute chart shows different bars. Almost always a different Trading hours template (bar boundaries shift with the session start) or a different contract month around the roll. Compare those two settings first.
Educational content, not investment advice. Futures trading involves substantial risk of loss. Examples are for illustration only. Read the full Risk Disclosure.