WotT Session Key Levels for NinjaTrader
Free session levels indicator for NinjaTrader 8 — London and New York highs and lows, the opening range, the initial balance, POC and value area drawn and labelled on your chart, identical on every chart type.
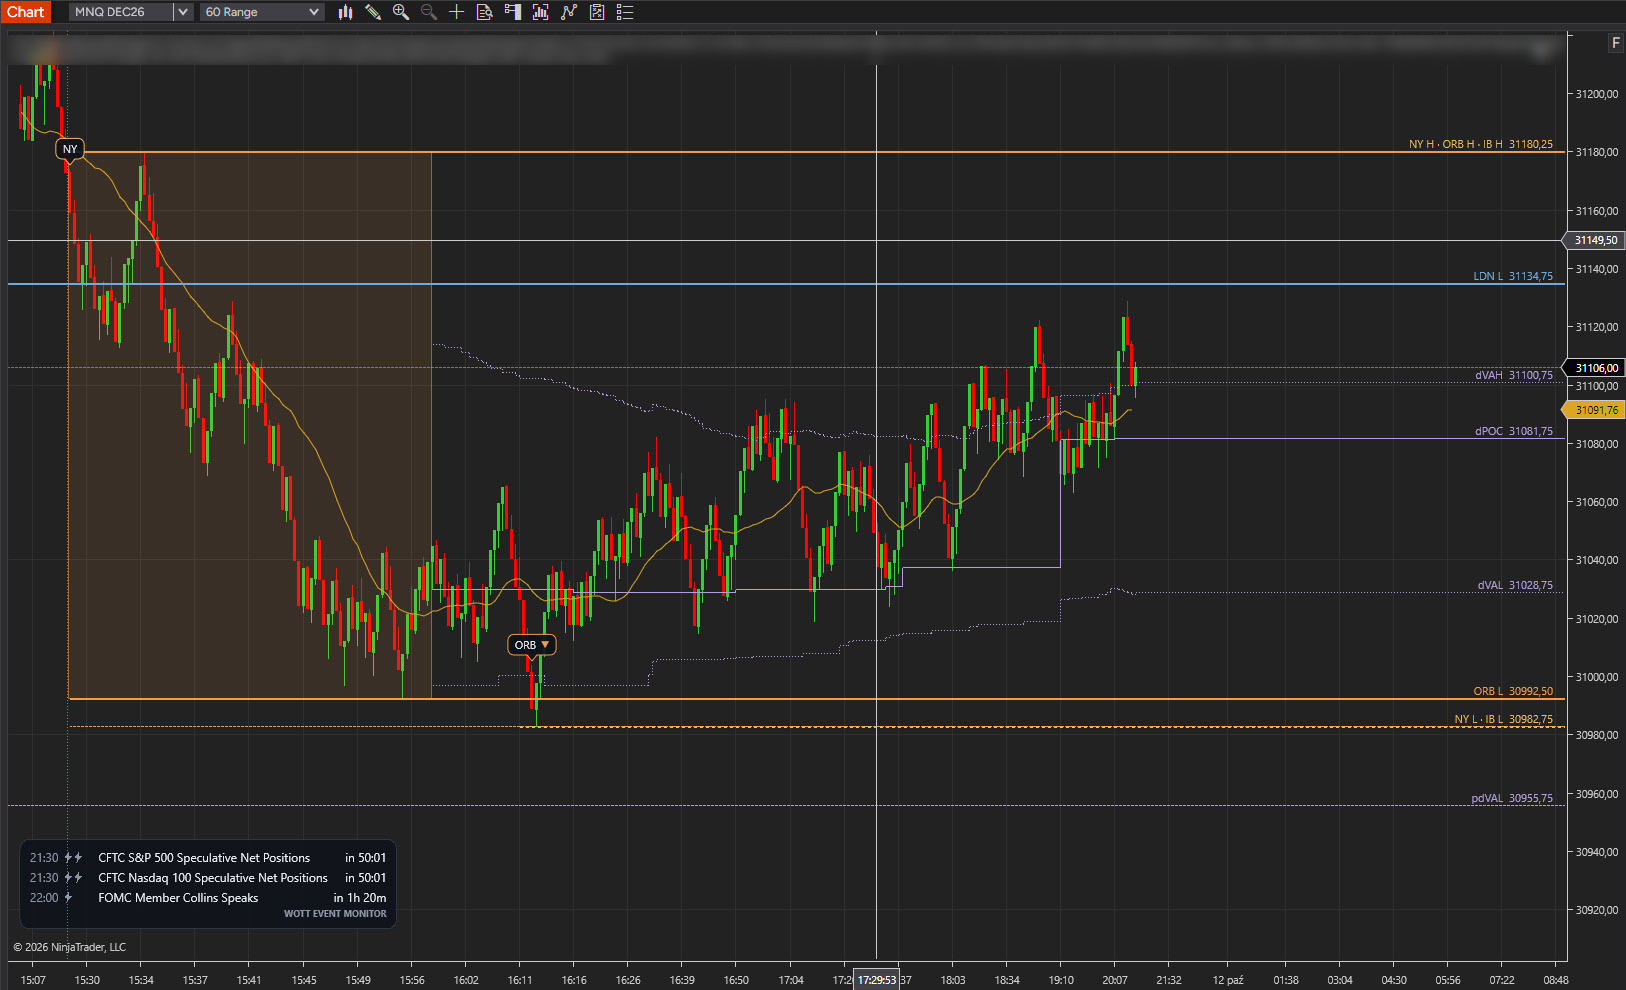
A levels indicator for futures traders who work the London and New York sessions: session highs and lows, yesterday's New York range, the first 30 and 60 minutes, and the volume levels of the session, each one named at the right edge of the chart. Runs entirely inside NinjaTrader 8 — no external data, no paid add-ons.
Levels
The lines you draw every morning, already drawn
Most of a session plan is the same handful of prices: where London topped and bottomed, yesterday's New York high and low, the first half hour, the first hour, where the volume sat. Marking them by hand takes ten minutes, and the lines end up slightly different on every chart you open.
WotT Session Key Levels draws them once, from its own data:
- The same price on every chart. The levels are measured on a 24-hour, 1-minute series the indicator loads in the background. A 30-range chart and a 5-minute chart show identical numbers, and a chart set to regular trading hours only still gets its London range.
- Session times that follow the markets. London is set in London time, New York in New York time. Daylight saving is handled on both sides, including the weeks when Europe and the US are out of step. Where your PC is doesn't matter.
- One tag per event. A small bubble on the candle that opened London, on the candle that opened New York, and on the first candle that closes outside the opening range. Nothing else gets a marker.
Visual only — by design. The indicator draws lines, labels and tags. It never places, moves or cancels an order.
Flow
How it works
Add it to a chart
Indicators → WotT Session Key Levels. Any intraday chart will do. The defaults fit US index futures: London from 08:00 London time, New York 09:30–16:00, a 30-minute opening range and a 60-minute initial balance.
It loads its own data
On the first load the indicator fetches 1-minute bars for the days on your chart, with 24-hour trading hours. That takes a moment, and it is the reason the levels don't depend on the chart you put it on.
Read the right edge
Every line is named where it ends, and today's lines carry the price. Levels at the same price share one label, such as
NY H · IB H. Lines from previous days are drawn fainter so today stands out.Watch the levels form
While a window is still open its lines are dashed or dotted and move with price. When the window closes they switch to their final style and stay put. The opening-range box closes after 30 minutes, the initial balance after 60, and today's POC and value area appear 30 minutes into New York and are drawn the way they moved.
Switch off what you don't trade
Every line has its own checkbox. One slider fades all lines and labels, another fades previous days.
The setup guide goes through the settings one by one, with three example setups.
Principles
Built like a trading tool, not a widget
The indicator has one job: put the session's reference prices on the chart, the same way every day. Everything else — entries, orders, risk — stays where it belongs.
Zero integration with orders
It draws. Nothing in it can place, change or cancel an order, and it has no link to an ATM strategy.
The chart type doesn't matter
Levels come from a background 1-minute series with 24-hour trading hours, not from the bars on screen. Range, tick, minute, regular hours only: the same levels.
Volume levels without Order Flow+
POC and value area are built from the 1-minute bars of your normal data feed. No extra licence, no tick data, no Tick Replay.
An estimate, labelled as one
A profile built from 1-minute bars is an estimate. In a check on four MNQ sessions it sat 2–3 points from a tick-by-tick profile on average and about 8 points at worst. Treat these levels as zones, not single ticks.
Labels
What the labels mean
Every line carries a short name at its right end. These are all of them.
| Label | Meaning |
|---|---|
LDN H / LDN L | London session high and low, from the London open until New York opens |
NY H / NY L | New York session high and low, 09:30–16:00 New York time |
pdH / pdL | High and low of the previous New York session — not of the whole futures day |
ORB H / ORB L | Opening range: the first 30 minutes after the New York open, also shaded as a box |
IB H / IB L | Initial balance: the first 60 minutes after the New York open |
IB M, IB 1.5x, IB 2x | Optional: the initial-balance midpoint and its 1.5× and 2× extensions |
pdPOC / pdVAH / pdVAL | Point of control and value area of the previous New York session |
dPOC / dVAH / dVAL | Today's point of control and value area, still developing, drawn as they moved |
LDN, NY (bubble) | The candle that opened the session |
ORB ▲ / ORB ▼ (bubble) | The first candle that closed above / below the opening range |
Features
At a glance
- London, New York and previous-session highs and lows
- Opening range (box and lines) and initial balance, both with adjustable length
- Optional initial-balance midpoint and 1.5× / 2× extensions
- Previous-session POC / VAH / VAL and today's developing POC / VAH / VAL; value-area percentage and row height adjustable
- Bubbles at the London open, the New York open and the opening-range breakout (both directions, first only, or off)
- Identical levels on every chart type and trading-hours template; they keep updating while the chart itself is outside its session
- Market time zones with automatic daylight-saving handling
- A checkbox for every line, seven line styles, opacity for all lines and for previous days, label font size, number of days shown
- Labels that share a price are merged; labels of close levels are placed so no line runs through the text
- Free — no subscription, no registration
Who it's for
User profile
A futures day trader — NQ/MNQ, ES/MES — who marks the London range, the opening range and yesterday's value area by hand every morning and would rather have them drawn, named and identical on every chart.
Requirements
Environment
- NinjaTrader 8 (8.1+) on Windows
- An intraday chart and a data feed with 1-minute history (any standard futures feed)
- Nothing else — no internet connection of its own, no accounts, no other add-ons
Next up, depending on what users ask for: Asia session high and low, a sound at the session open, and an optional exact volume profile for traders who have Order Flow+.
FAQ
Common questions
Why is pdH not the high of my daily candle?
pdH and pdL are the high and low of the previous New York session, 09:30–16:00 New York time, not of the whole 23-hour futures day. If the overnight session went further, the daily candle shows a different extreme. pdPOC, pdVAH and pdVAL come from the same session.
My volume profile shows a POC a few ticks away. Which one is right?
The tick-by-tick one. This indicator estimates the profile from 1-minute bars so that it works on any data feed without extra licences. Small differences are expected; use the levels as zones.
Does it work on range, tick or Renko charts?
Yes. The levels come from the indicator's own 1-minute data, so the chart type only decides where a line starts and which candle gets a bubble. It was built and tested on range and minute charts.
My chart shows regular trading hours only. Will I get the London levels?
Yes. The lines appear at the first candle of your session, and they keep updating in the background before it.
I trade in a different time zone. Do I have to convert the session times?
No. London is entered in London time and New York in New York time; the indicator converts them for you, daylight saving included.
Can I use it on other instruments or with other session times?
All session times, the opening-range length and the initial-balance length are settings. The defaults fit US index futures, and that is where it has been tested.
The ORB bubble sits on a different candle than on my other chart.
The bubble marks the first candle of that chart that closes outside the range. A range chart and a 5-minute chart close their candles at different moments, so the tag can land a few minutes apart. The levels themselves are identical.
It is too much on a higher time frame.
Switch off the lines you don't use, lower "Lines and labels opacity", lower "Previous days opacity" or reduce "Days to show".
Does it send alerts or place orders?
No. Version 1.0 is purely visual.
WotT Session Key Levels is an informational tool. Levels are calculated from the data your platform receives and can differ between data providers. Nothing here is investment advice. Trading futures involves substantial risk of loss.
Install
Three steps
Download the zip
Grab
WotTSessionKeyLevels_v1.0.0.zipbelow. Don't unzip it — NinjaTrader imports the archive as-is.Import into NinjaTrader 8
Tools → Import → NinjaScript Add-On → pick the zip. NinjaTrader confirms the import.
Add it to a chart
Indicators → WotT Session Key Levels → OK. Done — the levels appear as soon as the background data has loaded.
Before you use it
- Test it on a simulation account with the exact settings you plan to use.
- Watch your positions on every account. Be ready to flatten directly in NinjaTrader.
- Check that your prop firm or broker allows this kind of tool.
The tool is free and provided as is. Full terms: Software License.
📄 Installation guide (README) — requirements, import steps, quick start, update & uninstall.
Changelog
- Initial public release
- London, New York and previous-session highs and lows; opening range with box; initial balance with optional midpoint and 1.5× / 2× extensions
- Previous-session and developing POC / VAH / VAL, estimated from 1-minute data
- Bubbles at the London open, the New York open and the opening-range breakout; optional session-open lines
- The same levels on every chart type and trading-hours template; market time zones with automatic daylight saving
- A checkbox for every line, opacity controls, fainter previous days
- Free, closed-source, no subscription