Session Levels on the NinjaTrader Chart: Setting Up WotT Session Key Levels
London high and low, the opening range, the initial balance, yesterday's value area: the same handful of prices goes onto the chart every morning. WotT Session Key Levels draws them on a NinjaTrader 8 chart: installing it, the settings that matter, three setups, and what it deliberately doesn't do.
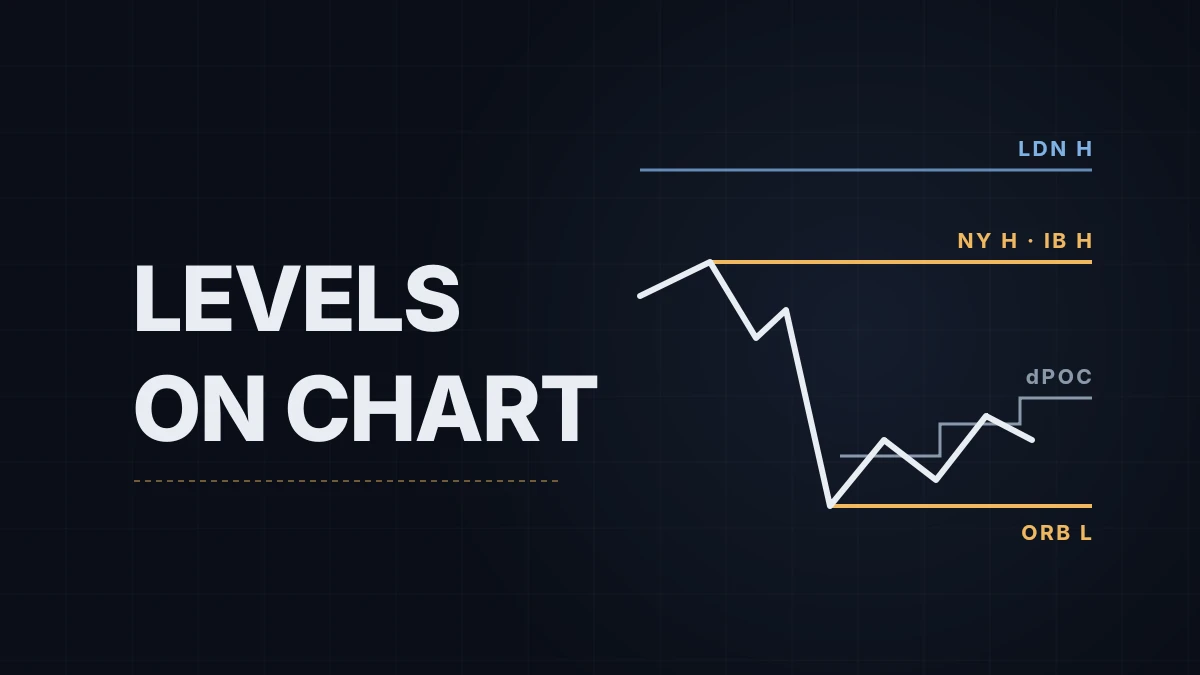
London high and low, the opening range, the initial balance, yesterday's value area: the same handful of prices goes onto the chart every morning, by hand, and comes out slightly different on every chart. WotT Session Key Levels draws them instead: each level as a line with its name at the right edge, and a small tag on the candles where a session opened or the opening range broke. It's a free indicator from this site, on the tool page. What the opening range and the initial balance are, and how traders use them, is covered in the opening range post; this one is about getting the lines onto the chart. If NinjaTrader 8 itself is new, chart setup comes first.
Installing it
Download the zip from the tool page, then in NinjaTrader 8 open Tools › Import › NinjaScript Add-On and pick the file. The indicator then goes on a chart like any other: Indicators › WotT Session Key Levels › OK. It needs NinjaTrader 8.1 or later on Windows and a data feed with 1-minute history, which every standard futures feed has. It makes no internet connection of its own.
The first time it loads on a chart it fetches 1-minute bars for the days that chart covers, so the lines take a moment to appear.
What it draws
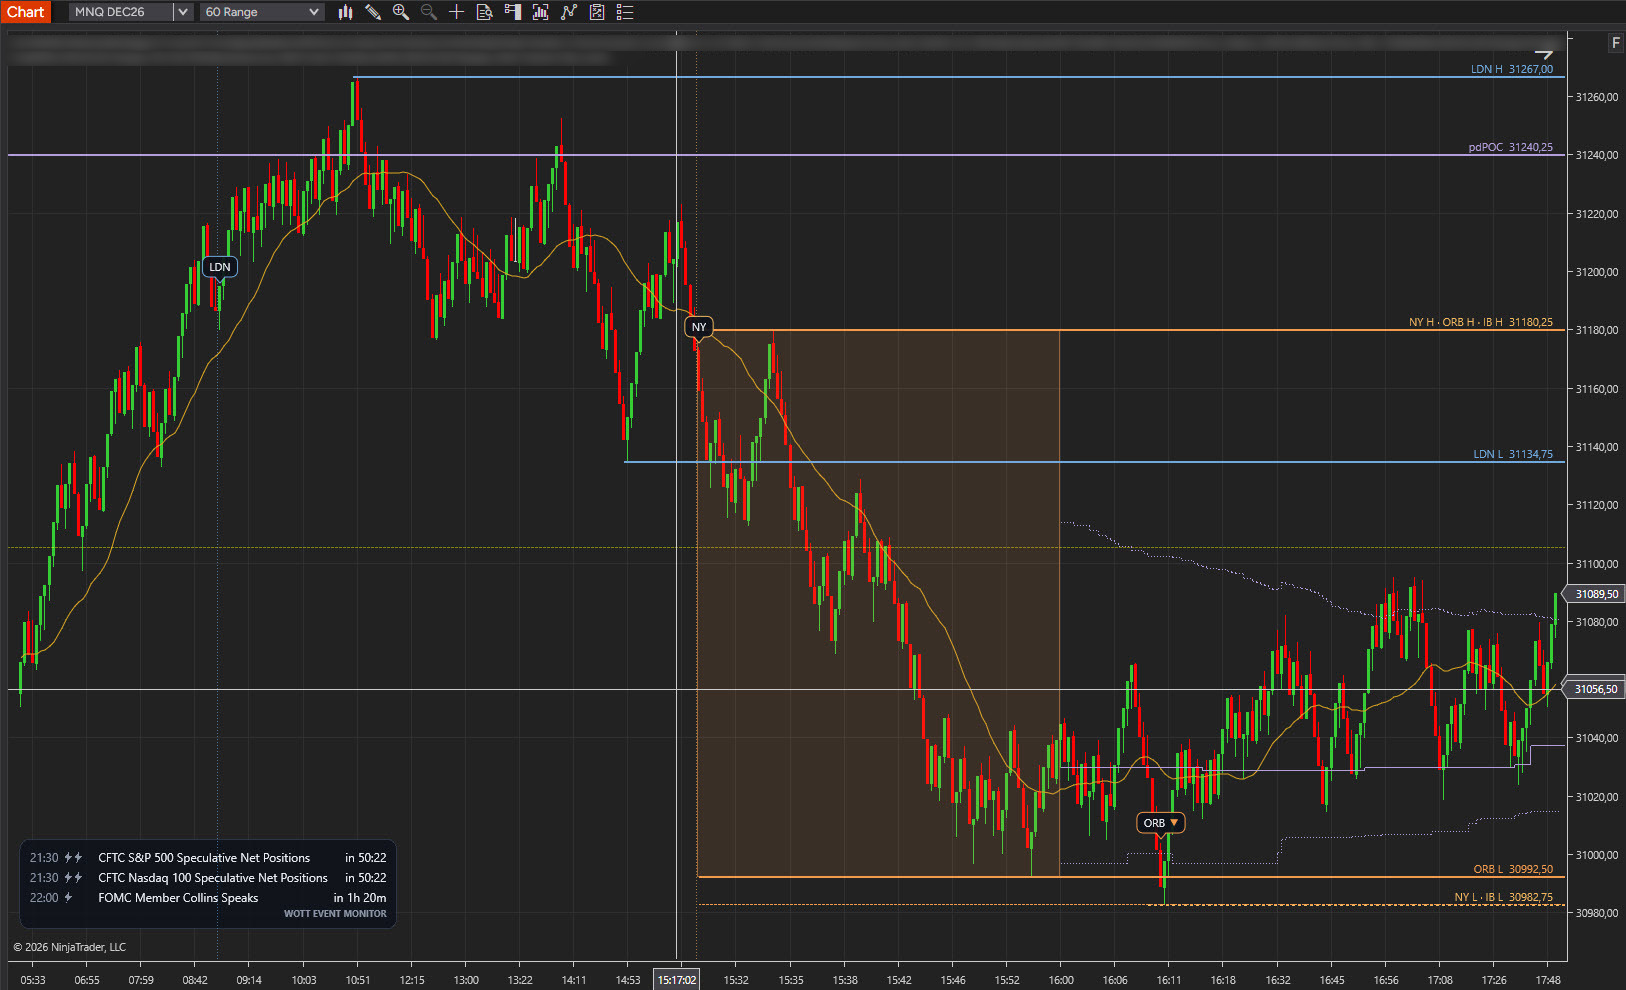
The London range comes first: LDN H and LDN L, measured from the London open until New York opens. Then the New York session, NY H and NY L, and the previous one, pdH and pdL. Those last two are yesterday's New York session, 09:30 to 16:00 New York time, and not the whole futures day, so they can differ from the high and low of a daily candle.
The first half hour of New York is the opening range: a shaded box with ORB H and ORB L running on to the end of the day. The first hour is the initial balance, IB H and IB L. On many days one side of the initial balance is the same price as the opening range or the session extreme, and then the lines share a label, such as NY H · ORB H · IB H.
The volume levels are the point of control and the value area of the New York session: pdPOC, pdVAH and pdVAL for yesterday, and dPOC, dVAH and dVAL for today. Today's appear 30 minutes into the session and are drawn as a staircase, each value from the minute it was reached to the minute it changed, so you can see how the value area moved and not only where it ended.
A level that is still forming is drawn dashed or dotted and follows price tick by tick. When its window closes, the line switches to its final style and stops moving.
Three kinds of candle get a small bubble: LDN and NY on the candles that opened the sessions, and ORB ▲ or ORB ▼ on the first candle that closes outside the opening range, once per direction per day.
Where the numbers come from
The indicator doesn't read the bars on your chart. It loads its own 1-minute series of the same instrument with 24-hour trading hours and measures everything there. That has two consequences. The levels are the same on a range chart, a tick chart and a minute chart. And a chart set to regular trading hours only still shows the London range, updating in the background before your session starts.
Session times are kept in their own time zones. London opens at 08:00 London time and New York at 09:30 New York time whatever the clock on your PC says, through both daylight-saving changes and the weeks in between when the two are out of step.
The volume levels are an estimate. They are built from 1-minute bars, each bar's volume spread evenly over its range, which works on any feed with no extra licence. In a check on four MNQ sessions the result sat 2–3 points from a tick-by-tick profile on average and about 8 points at worst. Read them as zones.
The settings that matter
| Setting | What it does | The trade-off |
|---|---|---|
| London range ends at the New York open, on by default | Freezes the London high and low at 09:30 New York time. Off: the range runs to the London close | Off gives the full London session, and levels that keep moving through the first hours of New York |
| ORB length, 30 minutes | Minutes after the New York open that form the opening range | A shorter range (5 or 15) is tighter and breaks earlier and more often; a longer one gives fewer, later tags |
| IB length, 60 minutes; IB midpoint; IB extensions | The initial balance, and optionally its midpoint and the 1.5× and 2× extensions | Extensions add four lines: useful on trend days, clutter on the rest |
| Levels, one checkbox per line | Shows or hides each line with its label | Every line left on is one more thing between you and price |
| Value area (%), Row height (ticks), Today's profile starts after | 70% of volume by default, one tick per row, today's profile from minute 30 | A bigger row steadies the POC on thin instruments; an earlier start shows a profile built on very little volume |
| ORB breakout bubbles: BothDirections, FirstOnly, Off | Which breakouts of the opening range get a tag | Both directions also marks the failed breakout; first only keeps one tag per day |
| Session open lines | A dotted vertical line at the London and New York opens | Easier to find the open on a compressed chart, one more line on a clean one |
| Days to show, 3 | How many days of levels are drawn | More days to compare, more lines on screen |
| Lines and labels opacity, Previous days opacity | Fades everything, or only the days before today | Fainter lines stay out of the way and are easier to miss |
| Start lines at the extreme, on by default | A high or low line begins at the bar that made it. Off: at the start of its session | On shows where the level was made; off gives longer lines that are easier to see at the left of the chart |
| Lines | Colour, width and dash style for each of the seven groups | Personal; keep London and New York easy to tell apart |
Session times themselves — London open, New York open and close, the start of the trading day — are settings too. The defaults fit US index futures.
Three setups
A trader who works the opening range wants the box, ORB H, ORB L and the breakout bubbles, with the previous session's high and low for context. The London lines and the volume levels can go, and the bubbles can be set to first only if the second break is not part of the plan.
A trader who thinks in value wants pdPOC, pdVAH and pdVAL from the first minute and today's developing levels once they appear, with the initial balance and its extensions for the days that leave it. The opening-range box can be switched off; the initial balance covers the same ground.
A trader who reads a higher time frame wants fewer and quieter lines: one or two days, previous days at 30% or lower, the lines opacity turned down, the session-open lines off, and only the highs and lows that matter for the plan.
Where the previous session's high and low and the value area come from, and the two ways such levels get used, is in key levels on NQ.
What it doesn't do
It draws and nothing more. It never touches orders, it has no alerts and no sounds, and its levels are not available to the Market Analyzer or the Strategy Builder.
It doesn't draw the profile itself, only the three levels that come out of it, and those are an estimate from 1-minute data. Anyone who needs the exact histogram needs a tick-based profile tool.
pdH and pdL are yesterday's New York session, not the whole day, and there are no Asia-session or overnight levels in this version.
The breakout bubble is placed on your chart's own candles, so two charts with different bar types can mark candles a few minutes apart. The levels are the same on both.
I built it for my own mornings. For most of the year London opens at 09:00 and New York at 15:30 in Central Europe, and before this the first minutes of each went into drawing lines on a range chart. Now they are there when I open the platform.
Educational content, not investment advice. Futures trading involves substantial risk of loss. Examples are for illustration only. Read the full Risk Disclosure.