Poor Highs, Poor Lows and Single Prints: Market Profile Clues on NQ
Three Market Profile terms for unfinished business: the poor high, the poor low and single prints. What each looks like in the letters, how it differs from a tail of excess, why row size and session choice change the picture, and why an unfinished auction is a hypothesis rather than a target.
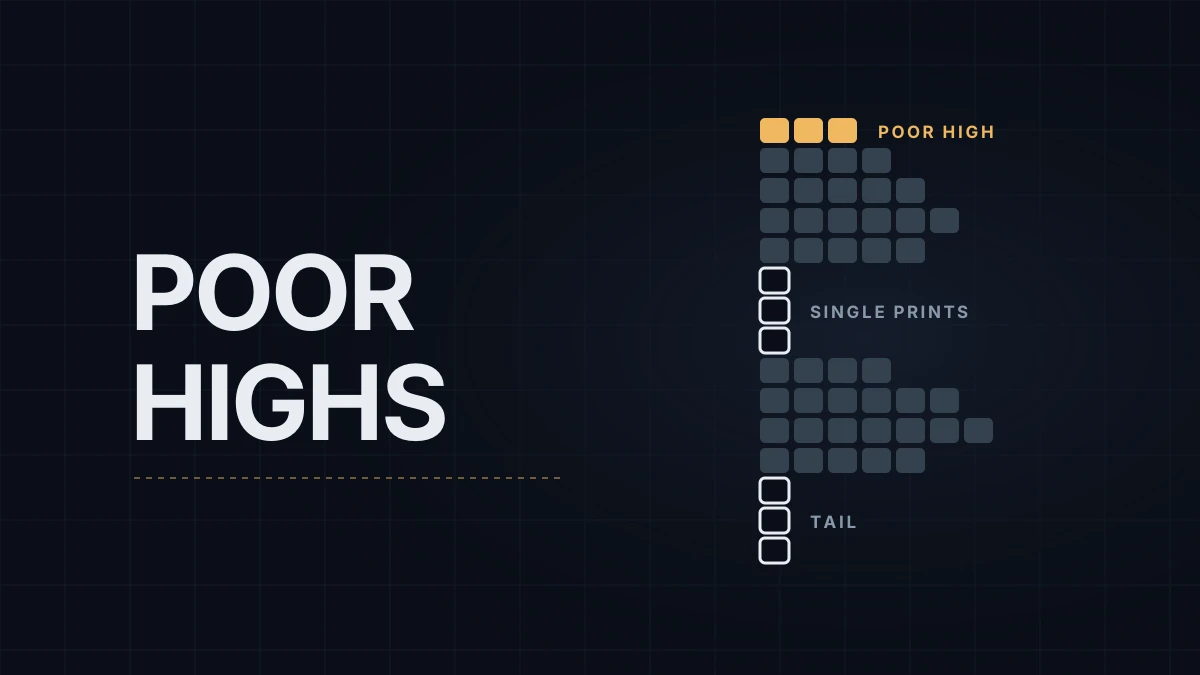
A poor high is a session high that price touched in two or more 30-minute periods and left without a tail. In Market Profile language the auction stopped up there without excess, the thin run of single letters that marks a market rejecting a price, and traders read that as unfinished business. A poor low is the same thing at the bottom of the session. Single prints are the third term: one-letter rows inside the range, left behind by a fast move, as opposed to the single-print tail at an extreme.
All three come from the letter-based TPO chart, explained step by step in Market Profile (TPO) on NQ. The examples below use NQ, the E-mini Nasdaq-100 future; tick and point value covers the contract itself.
| Feature | What the letters show | Usual reading | What it doesn't promise |
|---|---|---|---|
| Poor high or poor low | Two or more TPOs on the extreme row, no single-print tail beyond it | The auction ended without rejection at that price | That price comes back today, this week or at all |
| Excess (a tail) | Two or more single prints at the extreme, by the usual convention | Strong rejection; that end of the auction looks finished | That the extreme holds |
| Single prints | One-letter rows inside the range | A fast, one-sided move with little two-way trade | That the gap gets filled, or that it acts as support or resistance |
An illustrative session with 5-point rows: the top row is 25,240, touched in periods F, G and K, with nothing traded above. That top row carries three letters and no tail, so it's a poor high. The low came from a fast drop in period B that ran from 25,120 down to 25,105 and turned; those four rows hold a single B each, a tail with excess. In between, a run from 25,150 to 25,175 traded only in period D, which leaves six rows of single prints in the middle of the profile.
Settings change the picture
A poor high depends on how prices are grouped. In the session above, F, G and K might have topped at 25,240.25, 25,241.00 and 25,241.75. With 5-point rows all three land in the 25,240 row and the top looks flat. With one-tick rows, 0.25 points each, they sit on three different rows, and the top three ticks, 25,241.25 to 25,241.75, hold only K: a three-row tail, which counts as excess, and the poor high disappears. Larger rows create poor highs and smaller rows dissolve them; a tail's length in rows, and so whether it counts as excess, moves with the row size too.
The session matters as much. A profile limited to regular trading hours (RTH, 9:30 AM to 4:00 PM ET) has a different high from a full Globex profile whenever the overnight session made the extreme. A poor RTH high can sit right under an overnight high that already had its tail. TradingView's TPO indicator can mark single prints and poor highs and lows automatically, which is convenient, but it marks them for the row size and session on the screen.
Why "unfinished" is a hypothesis
The reasoning behind the poor high goes like this: an auction keeps moving until it runs out of buyers or sellers, a tail is the visible proof that it did, and a flat top is a sign it stopped early. That's a sensible prior about where the market may return. It isn't a measured probability for NQ, and revisit percentages quoted online rarely come with the sample, the row size and the session they were measured on, each of which changes the number.
There's also a simpler reason a poor high gets revisited: several periods topping at the same price is what equal highs look like on a bar chart, and stops tend to rest above equal highs, as in liquidity sweeps and stop runs on NQ. A trader who treats a poor high as a level where something may happen, rather than as a magnet price must reach, is using it the way the evidence allows.
Single prints get a similar test on later days. If price returns and slices through them quickly, the area is still being rejected. If it slows down and builds letters there, the market is accepting prices it skipped the first time.
Educational content, not investment advice. Futures trading involves substantial risk of loss. Examples are for illustration only. Read the full Risk Disclosure.