Liquidity Sweeps, Equal Highs and Stop Runs on NQ: What Is Mechanical and What Is Folklore
Equal highs collect stops, triggered stops become a burst of aggressive orders, and a large seller can fill against the burst: mechanics you can watch on a heatmap once the stops fire. That someone drove price there on purpose, or that a sweep predicts a reversal, is not. The two separated, on NQ.
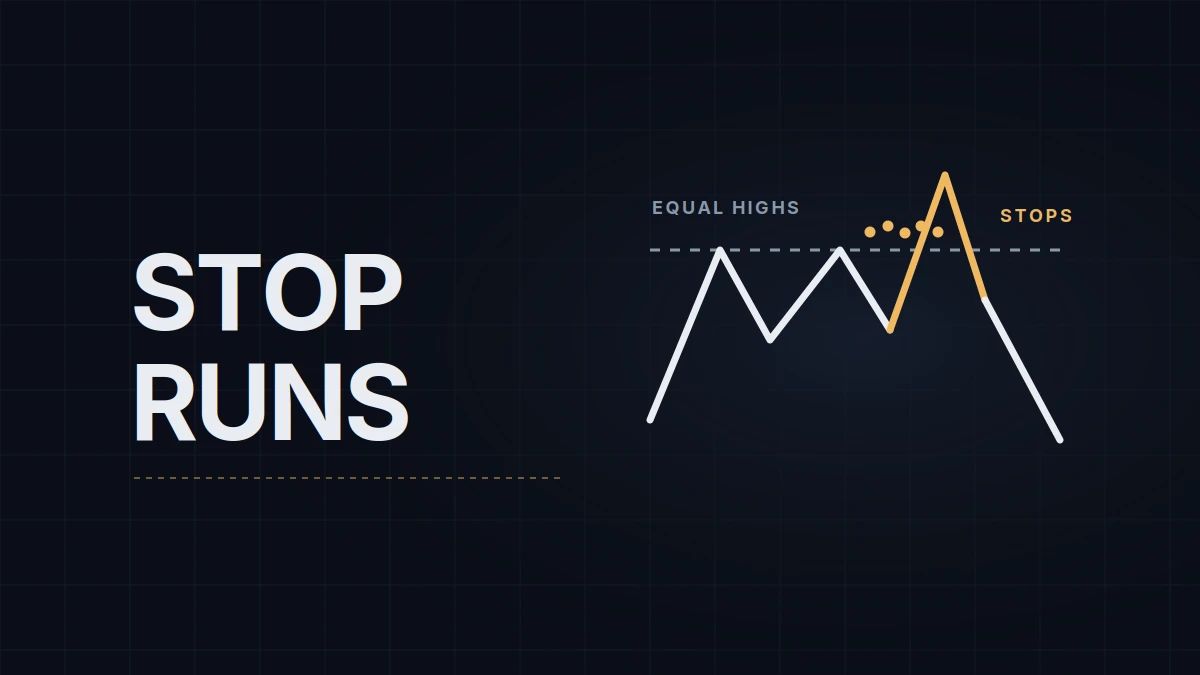
A liquidity sweep is a move through an obvious high or low that triggers the stop orders resting beyond it and then turns back. The term is popular in the "smart money concepts" corner of trading YouTube, where it arrives with a story attached: large players drive price into the stops on purpose, collect the liquidity and reverse. Part of that story is order mechanics you can see on a heatmap once the stops fire, and part of it can't be checked from a chart. On NQ, the E-mini Nasdaq-100 future (tick and point values here), the two parts separate cleanly once you know where the stops sit and what they do when they fire.
The general case of levels and false breakouts is covered in support and resistance. This post is the narrower one: equal highs and lows, and the stops beyond them.
Where the stops sit
Equal highs form when price tops out two or more times within a few ticks of the same price, and equal lows when it bottoms out the same way. They collect stops for a dull reason: nothing on the chart is easier to see. A trader who shorted the second top puts a protective buy stop a few ticks above both. A breakout trader puts a buy-stop entry in the same place. Both are buy orders that aren't in the book yet. The prior day's high and low and the overnight extremes collect stops the same way (key levels on NQ covers how they get marked), and so do round numbers.
A stop sits outside the order book: it's neither a bid nor an offer until it fires. Depending on the broker it waits at the exchange, on the broker's server or on the trader's own PC until its trigger price trades, and in none of those places does it show up in the depth of market or on a heatmap. What the book does show is the other side: the offers resting just above the highs, which the stops will buy from.
What happens when price gets there
When the trigger price trades, each stop becomes a market order (on CME, one with a protection limit that caps how far it can fill), or a limit order that fills only as far as its limit price allows. A cluster of them turns into a burst of aggressive buying, usually over within seconds. The burst takes the offers at the first price above the level, then the next, and where the offers are thin it clears several prices in one go. That's the older, order-flow meaning of "sweep": an aggressive order that takes out more than one price level of the book.
In numbers, on a hypothetical chart: equal highs at 29,512.00 and 29,512.25, stops from 29,512.50 up. A buy stop at 29,513.00 fires and fills at 29,515.50, ten ticks away. That's $50 of slippage on one NQ contract and $5 on one MNQ, paid by the trader whose stop fired and measured from the trigger price.
The other side of those fills is where "liquidity" comes in. Anyone who needs to sell size needs buyers, and a burst of triggered buy stops brings a crowd of them to one price at once. A seller can use it without pushing price anywhere, as long as the order is ready when the buyers appear, and that's one reason the top of a sweep can be where a large sell order got filled.
What comes next depends on who arrives after the stops are spent. Stops are one-shot fuel: once triggered, they're gone. If new aggressive buyers keep lifting offers and price holds above the level, the move was a breakout. If the burst ends and nothing replaces it, price falls back through the level, and the breakout buyers who entered during the burst now have stops of their own below it. That second leg is the failed break or the rejection described in reversal trades at key levels.
On a heatmap and on range bars
On a heatmap such as Bookmap, a stop run is a column of large buy dots stacked across several prices within seconds, with the offers above the level vanishing as they're filled or pulled. What follows is the tell. More large buying at the new prices, with price stepping up, is a breakout finding buyers. Large buying with price no longer rising is absorption, a seller taking everything the stops and the chasers send, and it's the order flow read that traders who fade sweeps wait for.
Range bars lose the most useful feature of the event, which is speed. A range bar closes when its range is complete, whether that took four seconds or forty minutes, so a burst through equal highs and a slow grind through them can print the same bars. On a Range 30 chart (30 ticks, 7.5 points a bar on NQ) a sweep of a few ticks can show as nothing more than one bar's high poking through the level, and a larger one as a bar through the level followed by a bar in the other direction; nothing on the chart says the first bar took three seconds. Bar types explained covers why, and it's the reason traders who read sweeps on range bars keep a heatmap or time and sales next to them.
Mechanical or folklore
| Claim | Verdict | Why |
|---|---|---|
| Stops cluster just beyond equal highs, equal lows and other obvious levels | mechanical, visible once they fire | traders place stops relative to the same visible prices |
| Triggered stops produce a burst of aggressive orders and slippage | mechanical | a stop becomes a market or limit order when its price trades |
| A large order can fill against the burst | mechanical | the burst is a crowd of counterparties at one price |
| Other traders can see your stop in the order book | false | stops aren't in the book until they trigger; only whoever holds one (the exchange, the broker or your platform) knows it's there |
| Price was driven to the stops on purpose | can't be checked from the chart or public data | the chart looks the same either way, and reaching a nearby high takes no push on a day that covers its average range |
| Equal highs are built on purpose to collect stops | can't be checked from the chart or public data | two tops at one price are what a range looks like |
| A sweep means a reversal is coming | not established | the label tends to be applied after the reversal; the same moves that kept going get called breakouts |
The last row carries most of the folklore. A pattern that's only named once it has worked can't fail by construction, and any base rate for "sweep, then reversal" is only as good as a definition written before the outcome is known. Testing it works like testing any setup: define the sweep in advance (how far beyond the level, how fast, how soon back inside), then count every occurrence, including the ones that became breakouts.
Telling the two apart while it happens
Three reads help separate a stop run that fails from a breakout that holds, and the first two show within a few bars. Time beyond the level: a sweep is back inside within a bar or two, while a breakout builds a base above. The aggressive side after the burst: buying that stalls against a refilling offer points to a failure, and buying that keeps lifting offers points to acceptance. And the retest: a breakout holds the old high from above, while a sweep can't get back over it.
At a level I marked before the session, a burst through it that stalls and falls back inside is what my key level reversals wait for: a failed break if a Range 30 bar closed beyond the level first, a rejection if none did. The heatmap is the veto: absorption at the level says the trade is live, its absence says wait. A burst that keeps finding buyers above the level is a breakout, and not my trade.
Educational content, not investment advice. Futures trading involves substantial risk of loss. Examples are for illustration only. Read the full Risk Disclosure.