Support and Resistance: How Levels Form and Why Price Reacts to Them
Support and resistance are prices where limit orders, stop orders and a lot of people's memory sit on top of each other. Where levels come from, why price reacts, why breakouts fail, and three ways traders use a level.
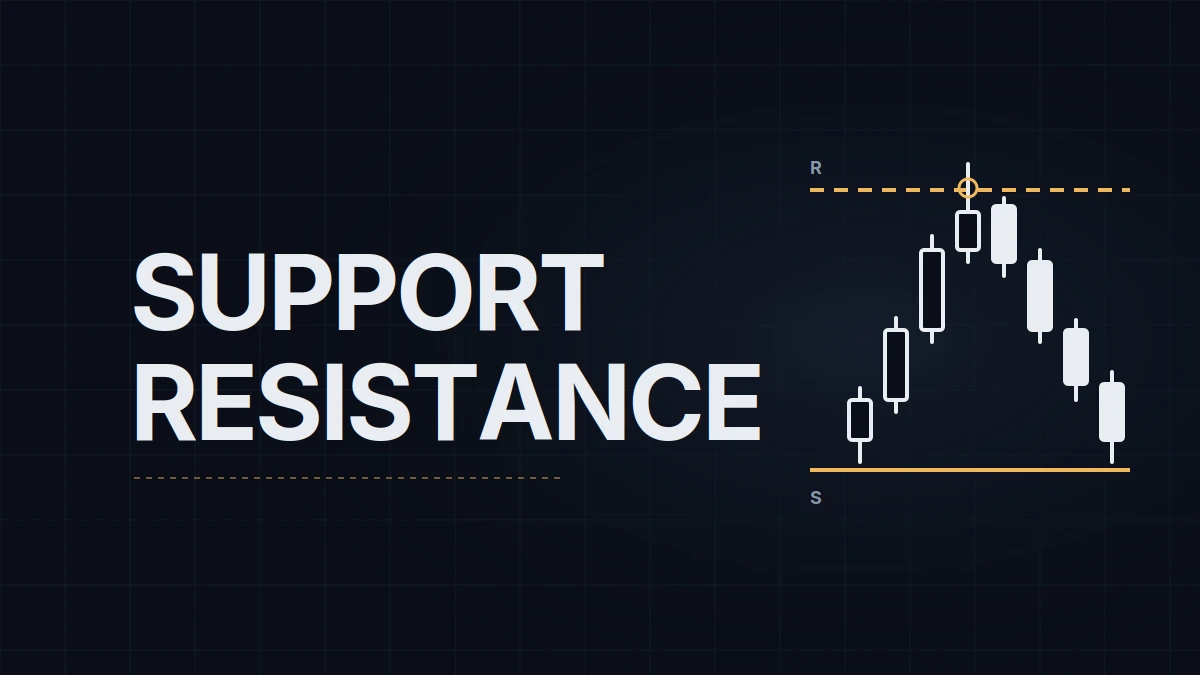
Support is a price where a decline has stopped before, because buying there was heavy enough to absorb the selling. Resistance is the same thing upside down: a price where rallies have stalled because sellers were waiting. That is the textbook version and it is true as far as it goes, but it doesn't say why a decline stops at 20 points above yesterday's low rather than 30, or why the level that held twice this morning gives way on the third touch. The answer is in the order book, and once you can see a level as a pile of orders rather than a line on the chart, most of what levels do stops being mysterious.
Where a level comes from
Four things put orders at the same price.
Resting limit orders. Traders who want to buy a pullback don't chase; they leave a limit order at the price they consider cheap, and many of them consider the same price cheap: yesterday's low, the bottom of the overnight range, the low of the last swing. The book is thicker there than at the prices around it, so a decline into that area meets more passive buying per tick than it met on the way down.
Stop orders on the other side. Everyone who is short from above a support level has a stop somewhere above it; everyone who bought the level has a stop below it. A stop is a market order waiting for a trigger. Levels are surrounded by them, and that is the fuel for both the sharp reversal and the failed breakout described below.
Reference points people watch. The previous day's high and low, the session open, the overnight range, the volume profile's point of control and value area edges, round numbers. These work partly because of the orders sitting there and partly because they are watched: enough traders act at the same price that it starts behaving as if it mattered. On NQ a short list is enough; the levels most NQ day traders mark covers which ones and how to draw them.
The origin of a fast move. When price leaves an area in a hurry, the orders that were resting there didn't all get filled. The base of an impulse, the last consolidation before a breakout, is where buyers were in control and some of them are still waiting. Price returning there finds them, which is why the start of a strong move is often a better level than a line drawn through wicks.
Why price reacts
At a level two things happen at once. Passive orders absorb the aggressive ones: sellers hitting the bid find a wall of limit buys and the price stops moving down even though selling continues. And the aggressive side runs out: the sellers who were going to sell into the decline have mostly done it by the time price reaches the level, so the market is left with buyers and nothing to sell to them. The size of the reaction depends on how many people are positioned the wrong way. A level with a crowd of trapped shorts above it produces a violent bounce when their stops go; a level nobody is short against produces a pause.
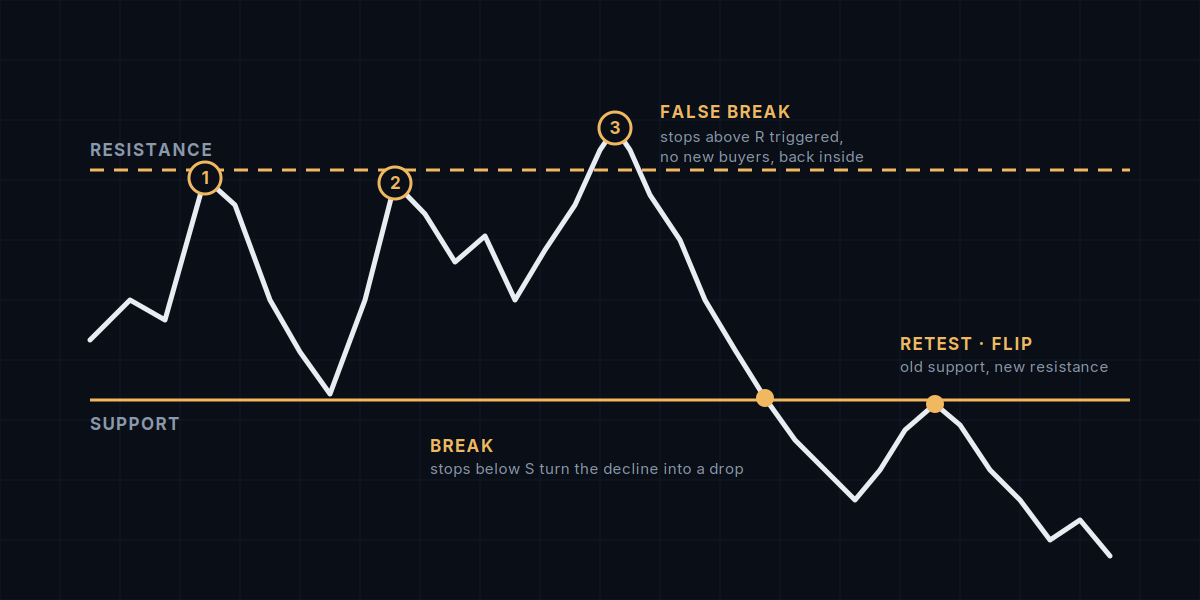
Each test consumes some of what made the level. The first touch meets the full stack of limit orders; a decent share of them fill and are not replaced. The second touch meets less. By the third, the buyers who wanted to be long from that price mostly are, and the stops below it have grown, so the level is thin on one side and loaded on the other. This is why "the more a level is tested the stronger it is" is backwards for intraday levels: repeated tests within one session usually mean the level is being eaten, and the break, when it comes, has all those stops to feed on.
The flip
A level that breaks doesn't disappear; it changes sides. Say resistance at a prior high finally gives way. The traders who sold that level are now short and losing, and a return to it is their chance to get out even, so they buy the retest. The traders who bought the breakout have stops just under the old resistance, so they defend it too. The sellers who would have leaned on the level have been proven wrong once and are less willing the second time. The old ceiling now has buyers on it from three directions, and the market treats it as a floor.
The flip is the reason the retest of a broken level is the entry most traders eventually settle on. It also explains why the first retest matters most: the trapped traders who create the support are only trapped once.
Why breakouts fail
A false breakout is the stop mechanism from above running in reverse. Price pushes through resistance. The push triggers the buy stops of the shorts and the entries of the breakout traders, a burst of market buying that fills into the sell limits parked just above the level, from traders who want to sell the extension. If no further buying arrives, the burst is over in a few seconds, price is back inside the range, and now the breakout longs are the ones with stops, just below the level they bought. Those stops turn the retreat into a drop. The signature on a chart is a wick beyond the level, a quick return and acceleration the other way.
Nothing about this requires anyone to be "hunting" stops on purpose; it is what a pile of stops does when the buying behind a break is thinner than the selling waiting above it. The practical test is follow-through: a breakout that holds above the level for a few bars and builds a base there has found buyers; one that comes straight back has not.
Three ways traders use a level
| Approach | Entry | Stop | What it costs |
|---|---|---|---|
| Fade | limit at the level, against the move | beyond the level, past the wicks | fills exactly when the level is about to break; the third test is often the one that fills you and fails |
| Break | market or stop order as price clears the level | back inside the range | false breakouts fill you at the worst price and stop you out on the return |
| Retest | limit at the broken level after the flip | past the old level | strong breaks don't come back, and the trade is missed |
Each approach loses in a different situation. The fade pays for false breakouts and loses on real ones; the break does the opposite; the retest gives up the strongest moves in exchange for the cleanest entries. None of them is right in general, which is why the same level is bought by one trader and sold by another with both of them following a rule.
Two things about drawing levels follow from all this. A level is a zone, not a line: the orders sit across a few ticks, and the wicks that tested it show how wide the zone is. And fewer is better. A chart with twelve horizontal lines has a level every 30 points, which is another way of saying it has none; the ones worth keeping are the ones other traders can see too.
I mark levels before the open from the previous session and the volume profile, and then treat them as places to wait rather than as signals. The level says where a reaction could happen; whether it does is decided by what the tape does when price gets there, and that is a different question from the one this post answers.
Educational content, not investment advice. Futures trading involves substantial risk of loss. Examples are for illustration only. Read the full Risk Disclosure.