How to Read a Price Chart: Candlesticks, Bars and Line Charts from Zero
The from-zero guide to reading a price chart: how a candlestick, an OHLC bar and a line chart draw the same four numbers, what a long wick or a small body means, why one candle can't tell you what happened inside it, and five named patterns described as what they are.
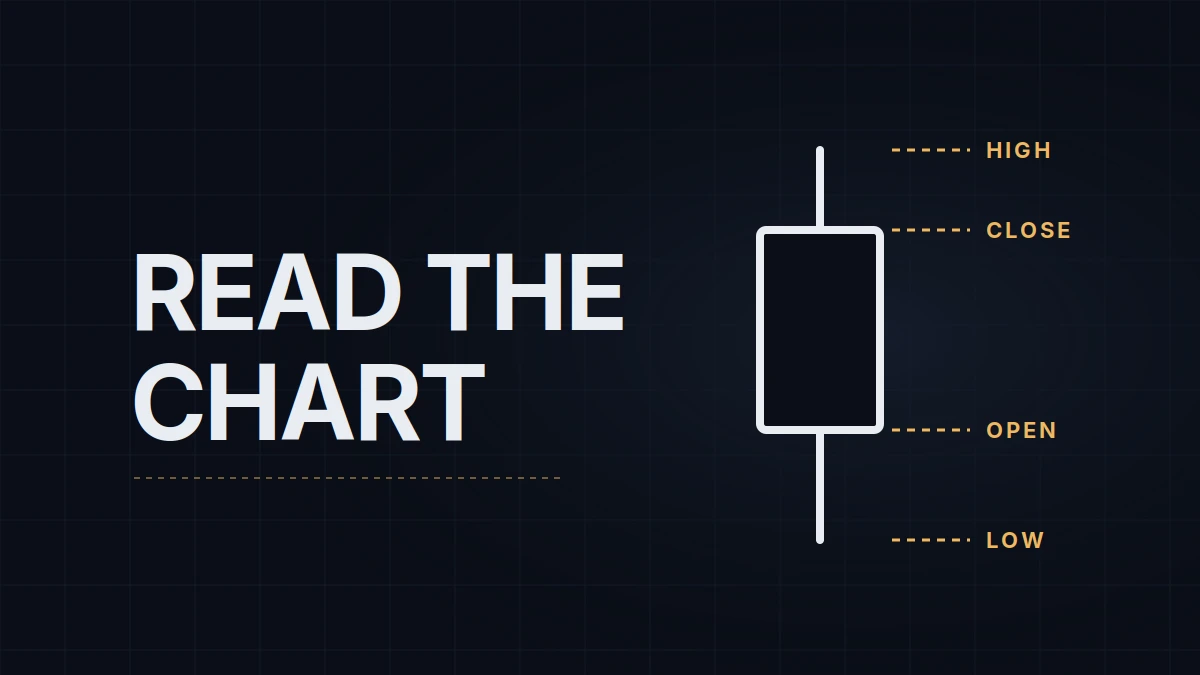
Take one candle from any price chart. It is four numbers drawn as one shape: the price when the period started (open), the highest price traded during it (high), the lowest (low), and the price when it ended (close). Everything else on the chart, every bar, pattern and trend line, is built from those four numbers repeated. If you can read one candle, you can read a price chart; the rest is learning what the platform does with them, which the NinjaTrader 8 chart setup post covers on the tool side.
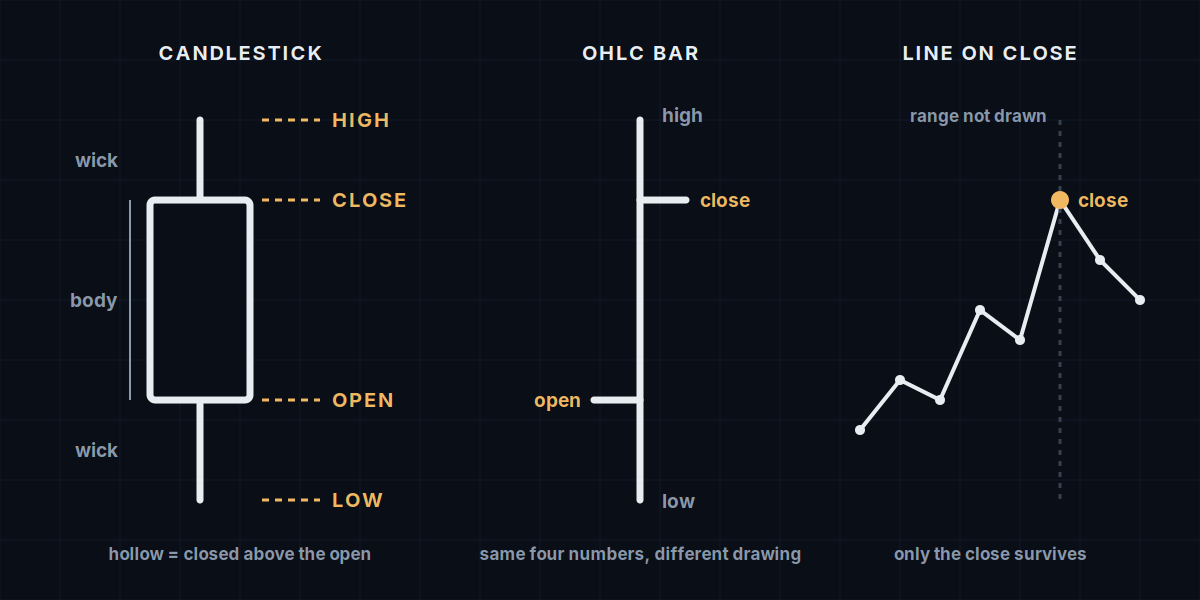
The four numbers and the two parts of a candle
The body is the rectangle between the open and the close. The thin lines above and below it are the wicks (also called shadows or tails), and they run to the high and the low. A candle whose close is above its open is an up candle; below, a down candle. Which color means which is a setting in every platform, and on this site green and red are reserved for profit and loss, so the drawings here use hollow for up and filled for down.
The body tells you where the period ended relative to where it began. The wicks tell you how far price traveled beyond that and came back. A 20-point candle on NQ with a 2-point body says the market covered 20 points and finished almost where it started; a 20-point candle that is all body says it went one way and stayed there. In dollars, that 20-point range is $400 per NQ contract and $40 per MNQ, which is why the contract you trade decides what a candle costs you.
The same four numbers, three ways
| Chart style | What you see | What you lose | When it's used |
|---|---|---|---|
| Candlestick | body between open and close, wicks to high and low | nothing; all four numbers are drawn | the default almost everywhere |
| OHLC bar | a vertical line from low to high, a tick left for the open, a tick right for the close | nothing, but the open/close relationship is harder to see at a glance | traders who find candle bodies visually loud; older textbooks |
| Line on close | one point per period, joined | the open, the high and the low: three of the four | long-horizon views where the range inside each period doesn't matter |
The line chart is the one to be careful with. It looks cleaner, and it hides the wicks, which is exactly the information about rejection and reach that most intraday decisions rest on. Use it for a monthly view of where the market has been; don't use it to decide where to put a stop.
What a candle tells you, and what it can't
A long body with short wicks means the period was one-sided: buyers or sellers had control from open to close. A small body with long wicks means the opposite, a fight that ended near where it started. A long wick on one side only means price pushed that way and was pushed back, so the wick points at a price that, for this period, didn't hold.
That last reading is the useful one and the most abused. A wick is a fact about one period: during those five minutes, or those 2,000 trades, price reached a level and came back. It says nothing about the next period, and it doesn't say why.
There are also things a candle can't tell you, no matter how you stare at it. It doesn't show the path: a candle with a high and a low doesn't reveal whether the high came first or the low did, and two candles with identical open, high, low and close can come from opposite sequences of trades. It doesn't show volume; how many contracts traded is a separate plot. It doesn't show who was trading or why. Every story you've read about "buyers stepping in" at a wick is an interpretation layered on four numbers.
One candle, many clocks
The candle's anatomy is the same on every chart; what changes is how long a period is. On a 5-minute chart each candle is five minutes. On a 2,000-tick chart each candle is 2,000 trades, which might be six seconds at 9:30 AM ET / 15:30 CEST and six minutes at 4:00 AM ET / 10:00 CEST. On a range chart each candle is a fixed height and the clock is irrelevant. A single 15-minute candle contains three 5-minute candles, and its body and wicks summarize theirs.
This is why "a big wick" means nothing without the chart it printed on. A 30-point wick on an hourly NQ chart is a normal afternoon; on a 1-minute chart it's an event. Read the axis before you read the candle.
Candles in a row
One candle is a period; a sequence is structure. Closes that step higher, with each pullback holding above the last one, are what "uptrend" means when you take the word apart: higher highs and higher lows. The mirror image is a downtrend. Candles that keep closing inside the same band, with wicks poking out on both sides and coming back, are a range. A moving average turns that sequence of closes into a single line, with nothing in it that the closes didn't already show.
The wick clusters are worth a second look. When several candles, on any timeframe, leave wicks at the same price, the chart is showing you a level where price has been rejected more than once. That level is the basis of support and resistance, which gets its own post in this topic. The level comes from the wicks and closes; the line someone draws on it comes second.
Five named patterns, described as what they are
Candle patterns have names, and the names travel with a lot of folklore. Here are the five you will meet most, described as what they record rather than what they promise.
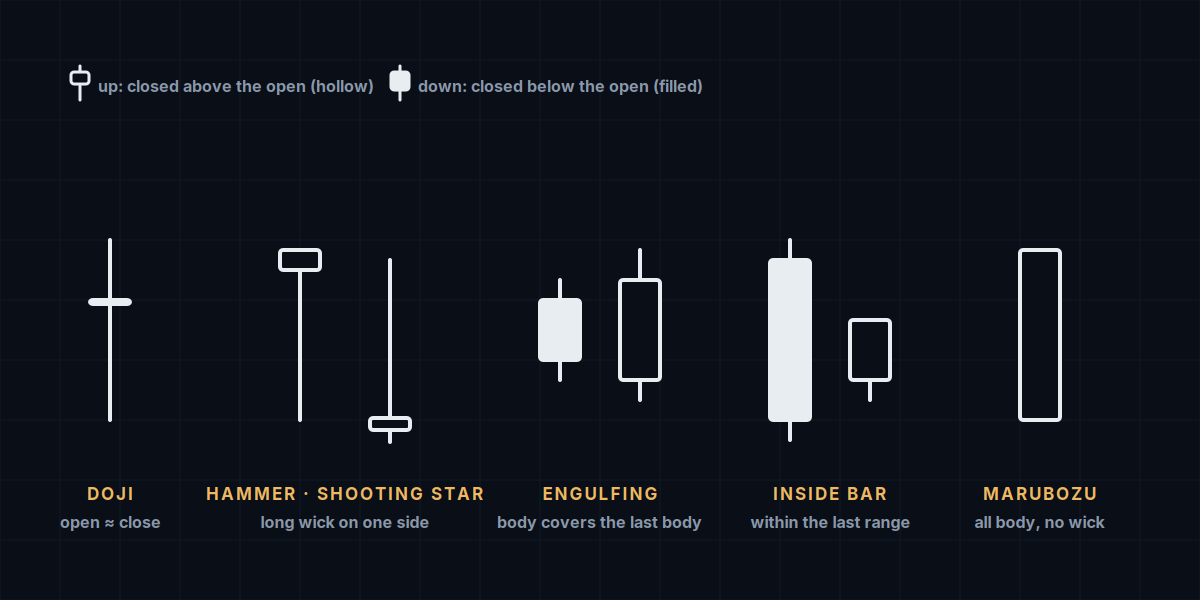
A doji is a candle with almost no body: open and close nearly equal, wicks on one or both sides. The period ended where it started. A hammer is a small body at the top of the range with a long lower wick, printed after a decline; its inverse at the top of a rise, small body low and long upper wick, is a shooting star. Both are the one-sided-wick reading from above, given a name for where they appear. An engulfing candle has a body that fully covers the previous candle's body in the opposite direction: a down candle followed by an up candle whose body spans it, or the reverse. An inside bar stays entirely within the previous candle's high and low, a period of contraction after expansion. A marubozu is all body and no wick, a period that opened at one extreme and closed at the other.
None of these is a signal on its own. Studies that test single-candle patterns in isolation across markets find results close to a coin flip, and that matches what the anatomy says: a hammer is a wick, and a wick is one period of rejection at one price. Where these shapes do carry information is in where they print. A hammer at a price that has rejected twice before on a higher timeframe is a different fact from a hammer in the middle of nowhere, and the difference is the level, not the candle. The rest of this topic is about that "where".
A reading habit
Three questions, in order, for any candle that catches your eye: where did it close relative to its own range (near the top, the bottom, the middle); how big is it compared with the candles around it; and where is it relative to the last swing high and swing low. Answer those and you have read the candle; the name, if it has one, is optional.
My own use of candles is narrow. I read them at levels I marked before the session, and the only question is whether price got rejected there: a wick that reaches the level and closes away from it is the entry condition I'm looking at, on a chart with those levels drawn and little else. I couldn't tell you the last time a pattern's name entered the decision.
Educational content, not investment advice. Futures trading involves substantial risk of loss. Examples are for illustration only. Read the full Risk Disclosure.