Positive vs Negative Gamma on NQ: What Dealer Hedging Does to Intraday Behavior
The same 40-point drop into a level bounces on one day and runs 150 on the next, and often the difference is a hedging flow nobody on the chart can see. How dealer gamma works, what positive and negative regimes look like on NQ, where the GEX number comes from, and how far to trust it.
Somewhere on an options desk, a market maker who sold Nasdaq-100 calls this morning is buying NQ futures because the index went up. He is not bullish. He is trying to stay flat, and staying flat costs him a futures trade every time price moves. There are a few dozen desks like his, they all hedge the same way, and on some days the sum of it is large enough to decide whether the E-mini Nasdaq-100 spends the afternoon rotating inside a range or running through every level on the list. That sum is what "gamma exposure" tries to measure.
Delta, gamma, and why a dealer trades futures
An option is a contract whose value depends on the index. A call gains value when the index rises, a put when it falls. Delta is how much the option's value changes per one-point move in the index; a call with a delta of 0.5 gains half a point per point of index. Gamma is how fast delta itself changes as the index moves. Near the strike, gamma is large: a small move turns a 0.5-delta option into a 0.7-delta one.
A dealer is the market maker who takes the other side of customer option trades. He wants to collect the spread and carry no directional risk. So he offsets the delta of every option he holds with the underlying, and for Nasdaq-100 options the cheapest underlying is NQ futures. That offset is a delta hedge. Gamma is the reason the hedge has to be redone as price moves, and the sign of the dealer's gamma decides which way the redoing goes.
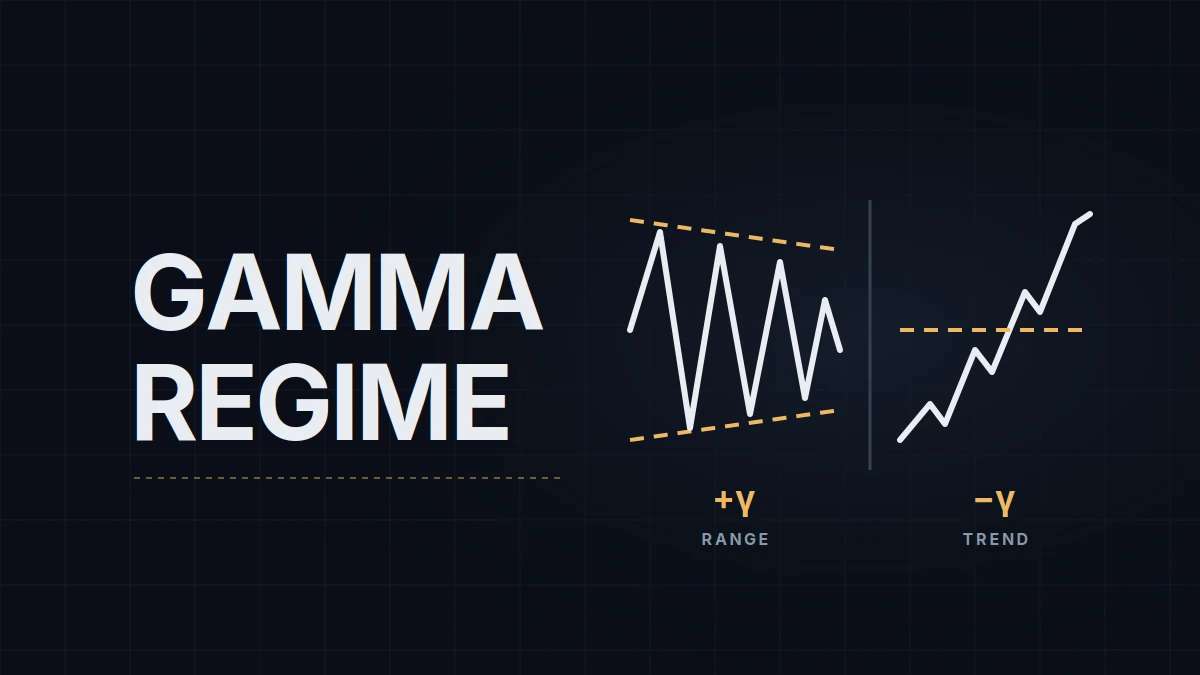
Take a dealer who is short options because customers bought them. As the index rises, the calls he sold gain delta, his position gets shorter, and to stay flat he has to buy futures. As the index falls, the puts he sold gain delta, his position gets longer, and he has to sell futures. Buying rallies and selling dips. Every hedge pushes price in the direction it was already going. That is negative gamma, or short gamma, and it amplifies moves.
Now a dealer who is long options because customers sold them, which happens whenever funds write covered calls or sell puts for income. As the index rises, his long calls gain delta and he sells futures to stay flat. As it falls, he buys. Selling rallies and buying dips. Every hedge leans against the move. That is positive gamma, or long gamma, and it dampens moves.
The regime everybody talks about is the net of all of that across every strike and every expiration. It also changes with price: below a certain level, called the gamma flip, the net turns from positive to negative because the puts customers bought start to dominate the calls they sold. Above it, the reverse.
Two days on the same chart
A positive-gamma day on NQ reads like a range day. The overnight high gets tested at the open and fails, not because sellers appear but because the buying that would have carried it through is being met by hedgers selling into it. A pullback to yesterday's value area high finds bids that were not there yesterday. Between 11:00 AM and 2:00 PM ET (17:00 to 20:00 CEST) the range compresses, and the day closes within a few points of a strike with large open interest, often the one it opened near. The day's range comes in below the average daily range.
A negative-gamma day reads like a trend day, and usually a fast one. The first pullback after the open does not hold, because the hedgers who would have bought it are selling. A key level that held for three sessions gives way on the first touch, the break extends instead of retracing, and the last two hours accelerate rather than fade. A reversal trade that has worked all week is stopped in the same bar it was entered. The range is wide, sometimes twice the average, and the close is at an extreme.
Neither picture is guaranteed. Positive gamma has been overrun by a Federal Reserve statement in one bar, and negative-gamma days have stayed quiet for hours because nothing started the move. The hedging flow is a tailwind or a headwind for whatever else is happening, not the thing happening.
Where the number comes from, and how far to trust it
Nobody publishes dealer positions. The exchange reports open interest at each strike, and every gamma exposure number, usually written GEX, is a model built on it: open interest at each strike, multiplied by that option's gamma, multiplied by the contract size, with a sign attached by assumption. The standard assumption is that customers buy puts and sell calls, so dealers are short puts and long calls. That is often right and sometimes badly wrong, which is why two vendors can publish different regimes for the same morning.
Four things limit how much weight the number can carry. It is estimated, not observed; Cboe's own study of the same-day S&P 500 options found market-maker net gamma, even at its extremes, to be a small fraction of daily futures notional, and balanced most of the time. Volume is not exposure: same-day options were 59% of S&P 500 index option volume in 2025 by Cboe's count, and the Nasdaq side has weekday expirations in the index options and in QQQ, so a large share of the day's gamma is opened after 9:30 AM ET (15:30 CEST) and gone by the close. The regime you read at 8:00 CEST is yesterday's closing book, and the morning flow rewrites it. And the Nasdaq-100 has three option markets that hedge into the same future, index options, QQQ options and options on NQ itself, and vendors differ on which of them they add up.
Monthly expiration, the third Friday, resets the picture, because the largest positions come off the book at once. December 18, 2026 is one of those Fridays and also the day the December NQ contract expires, so the regime the week after can look nothing like the week before.
Data vendors at the time of writing include SpotGamma, Menthor Q, Tier1 Alpha and Volland on the paid side, with free charts of NDX and NQ gamma from OptionCharts and FlashAlpha among others. They disagree with each other more than their marketing suggests.
Using it as a pre-session filter
A gamma report gives three numbers a futures trader can use, and each fails in a specific way.
| Number | What it is | How it's used | Where it fails |
|---|---|---|---|
| Regime | Sign of net dealer gamma at current price | Range day or trend day expectation; which setups get full size | Flips intraday as price crosses the flip level or 0DTE flow builds |
| Gamma flip | Price where net gamma changes sign | A level: above it, dips are bought by hedgers; below, sold | A modeled line, not an order; moves with every expiration |
| Call wall / put wall | Strikes with the largest gamma | Expected edges of the day's range; targets and places to expect stalls | Strongest into expiration, weakest after a gap that opens beyond them |
Traders use the report in three ways, and the ways conflict. Reversal traders treat positive gamma as permission: a level trade against the day's direction has the hedging flow on its side, so it gets full size; on negative-gamma days the same trade is smaller or skipped. Breakout traders read the same number the other way round and wait for negative-gamma days, when a break is more likely to extend than to fail; positive-gamma days are their no-trade days. And some traders use only the walls, adding the call wall and put wall to the level list next to the prior day's high and low, and ignore the regime entirely on the grounds that the levels can be verified on the chart and the regime cannot.
Each choice has a cost. The reversal trader sits out trend days that would have paid a breakout. The breakout trader sits out range days, which on NQ are not rare. The walls-only trader gets a level list that shifts every morning, and a strike is a place where hedging concentrates, not a place where anyone has to defend price.
The regime call is the first line of my pre-session notes, before the levels. On a positive-gamma day a reversal at a key level is trading with the flow that keeps ranges intact; on a negative-gamma day it is trading against it, so the size comes down or the setup waits. The number is a filter for which day it is, so it is written down before the session and not revised during it; a filter adjusted trade by trade is no longer a filter.
Educational content, not investment advice. Futures trading involves substantial risk of loss. Examples are for illustration only. Read the full Risk Disclosure.