Market Structure: Trend vs Range, Higher Highs, Lower Lows and Rotations
Every intraday method assumes a regime: reversals need a range, breakouts need a trend, and the same entry is right on one kind of day and wrong on the other. What higher highs, lower lows and rotations actually mean, how to read the day's structure early, and what to do when it changes.
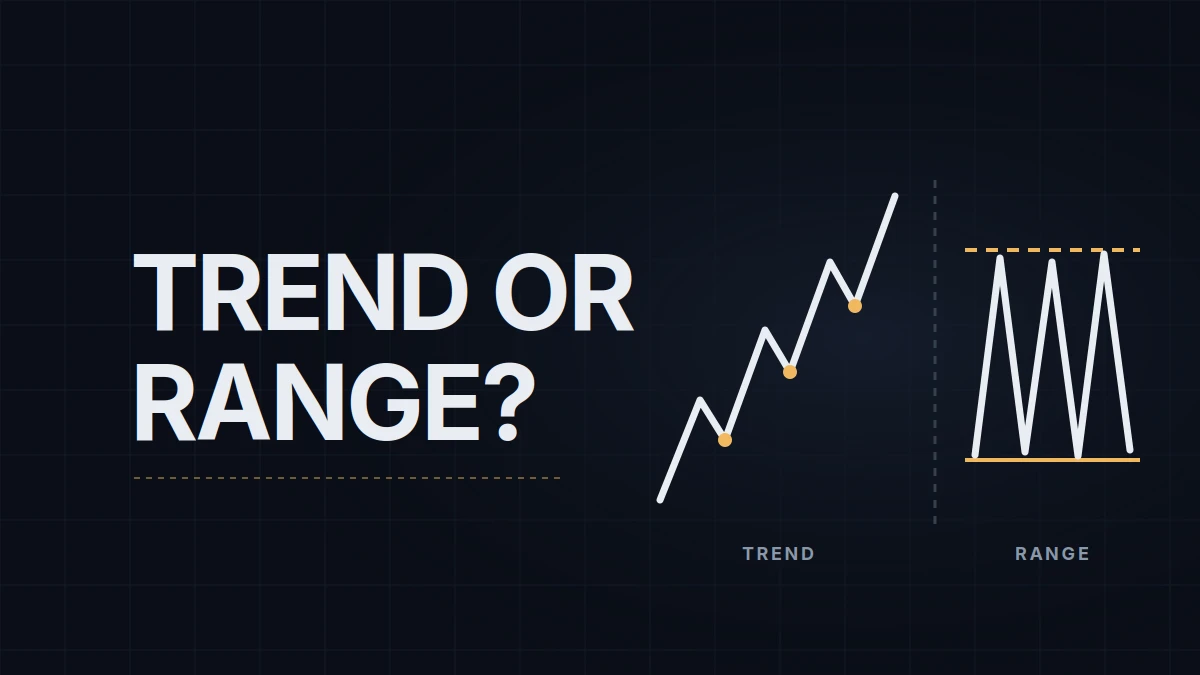
Most intraday methods are a bet on what kind of day it is. A reversal at a level works when the market rotates between levels; it fails on a day that leaves the level behind and never comes back. A breakout works on the day that keeps going and gets stopped out on the day that turns around in the same bar. Whether the entry was right depends less on the entry than on the regime, and the regime can be read from the chart with nothing but the sequence of swing highs and swing lows. That sequence is what traders mean by market structure.
Swings, and the four things they can do
Price moves in swings: a push in one direction, a pullback, another push. Each push ends at a swing high (in an up-move) or a swing low (in a down-move), and each pullback ends at the opposite kind of swing. Line up the swings and there are four possible sequences.
Higher highs and higher lows. Each push exceeds the last one; each pullback stops above the previous pullback's low. That is an uptrend, and the important half is the second: the higher low is where buyers proved they were still there before the previous high was tested. A pullback that holds above the last low, then breaks the last high, is the whole definition.
Lower highs and lower lows. The mirror. The lower high is the tell: sellers hit the market before price could reach the prior peak.
Overlapping swings inside two levels. Highs land near the same price, lows land near the same price, and each push reverses close to where the last one did. That is a range, and the moves inside it are rotations: price travels from one edge to the other and back, often with a pause at the middle. The edges are support and resistance in the ordinary sense, and the middle is usually the price with the most volume behind it.
A break of the sequence. An uptrend makes a lower low, or a range makes a higher high that holds. The sequence has changed, and with it the regime. This fourth case is where most of the money is won and lost, and it gets its own section below.
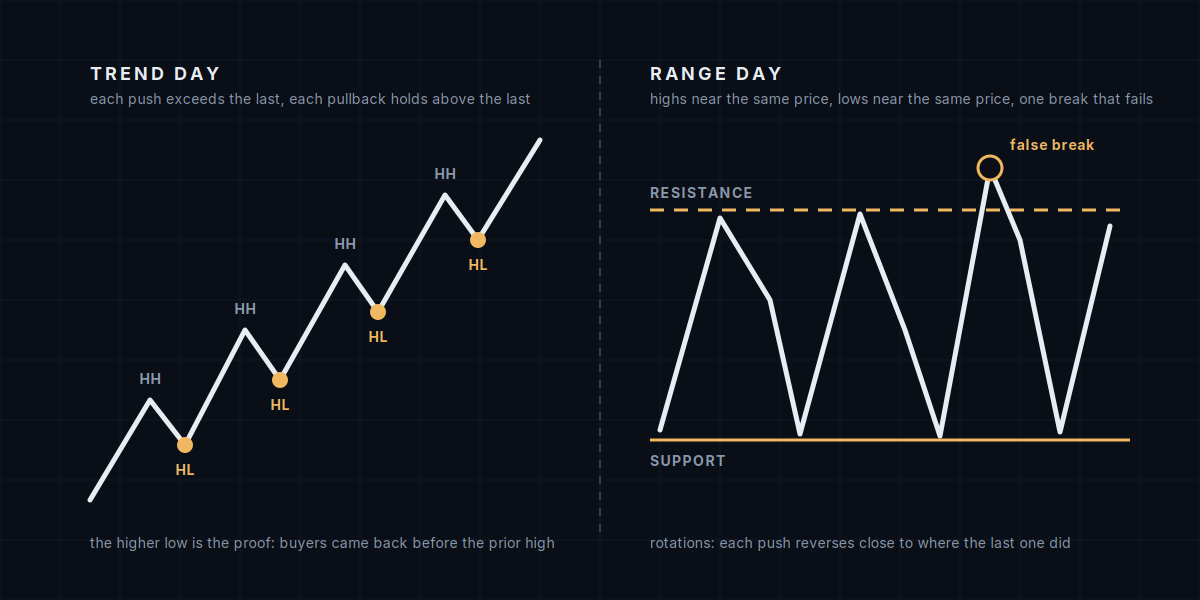
Trend day and range day
Two kinds of day cover most sessions on an index future. Their behavior is different enough that the same order does opposite things on each.
| Trend day | Range day | |
|---|---|---|
| What the swings do | pushes exceed the last one, pullbacks are shallow and stop early | pushes stall near the same prices, pullbacks retrace most of the push |
| The overnight range | left behind in the first hour and not revisited | contains most of the day, or is retested from outside |
| Pullbacks | are entries in the direction of the move | are the move; there is no "direction" to join |
| Reversals at levels | fail; the level is passed through with a wick at most | work; the edge of the range holds two or three times |
| Breakouts | work; the first break of the opening range or of a prior day's level continues | fail; the break returns inside within a few bars |
| Where the day closes | near one extreme of its range | near the middle of it |
Clean trend days are the minority on NQ, though dealer gamma tilts the odds on a given day. What can be planned is the order of operations: identify which day it is, then choose the tool, rather than choosing the tool and hoping for the day.
Reading the day early
The regime is only useful if it can be read before the day is over. Three questions, in the first hour of regular trading, answer it most of the time. The signs that come before them, from the overnight range to dealer gamma, and when each one is known, are in the trend day vs range day post.
Did the market accept a price outside yesterday's value and the overnight range, or was it rejected? An open that drives away from the overnight range and builds a pullback that holds outside it is the first higher low of a trend day. An open that pokes outside the range and comes back inside within a few bars has just failed a breakout, which is what range days do first thing.
Did the first pullback hold? On a trend day the first pullback after the initial drive is shallow, ends above the drive's midpoint, and gets bought before the prior high is reached. On a range day it retraces the whole drive and then some.
Is the sequence still intact at the hour? One higher high proves little; a higher high, a higher low that holds and a second higher high is a sequence, and a sequence is a regime. If by the end of the first hour there is no sequence, only overlapping swings inside a band, the day is telling you it is a range until it proves otherwise.
A note on timeframes, because the structure reading depends on which one you read it from. A 5-minute uptrend can be one rotation inside a range on the hourly, and a range on the 500-tick chart can be one pullback on the 5-minute. Pick one timeframe for the regime call and a lower one for the entry, and keep them fixed; the chart timeframe and bar type decide what counts as a swing, and switching between them mid-session produces a new regime every time you look.
When one turns into the other
A range becomes a trend when an edge breaks and holds. The break itself is not the evidence; ranges produce false breaks all day. The evidence is the first pullback after the break stopping short of the old edge, the flip described with the level mechanics in the support and resistance post, and then a new high beyond the breakout high. That is a higher low and a higher high outside the old range: the sequence has started.
A trend becomes a range when the pushes stop making progress. The first sign is a higher high that exceeds the previous one by a few ticks instead of a few points; the second is a pullback that retraces most of the last push; the third is a lower low, which ends the sequence outright. Between the first and the third sign the trend is still technically intact and the trades that rely on it are already losing, which is why "the trend is your friend until it ends" is true and useless: by the time the sequence has ended, three pullback entries have been stopped.
The practical rule is to grade the sequence, not to wait for it to break. A trend whose pushes shrink and whose pullbacks deepen is a trend to stop adding to. A range whose edges get tested at shorter intervals is a range about to break, and a range trade taken at the third test of the same edge in an hour is a trade against the odds.
My setups are reversals at levels, which is a range-day tool. On a day that reads as a trend by the end of the first hour, the tool is wrong for the market, and the plan's answer is smaller size or no trade rather than a better entry. That is also the reason the regime call comes before the setup in the daily routine and not after it.
Educational content, not investment advice. Futures trading involves substantial risk of loss. Examples are for illustration only. Read the full Risk Disclosure.