The VIX is the volatility index everyone quotes, but it measures the S&P 500. The Nasdaq-100 has its own: the Cboe Nasdaq-100 Volatility Index, ticker VXN, launched in 2001 and calculated with the same method as the VIX. It reads the prices of Nasdaq-100 index options and turns them into the market's expected volatility over the next 30 days, as an annualized percentage. With one division, that number becomes an expected move in NQ points.
From an annual percentage to a daily move
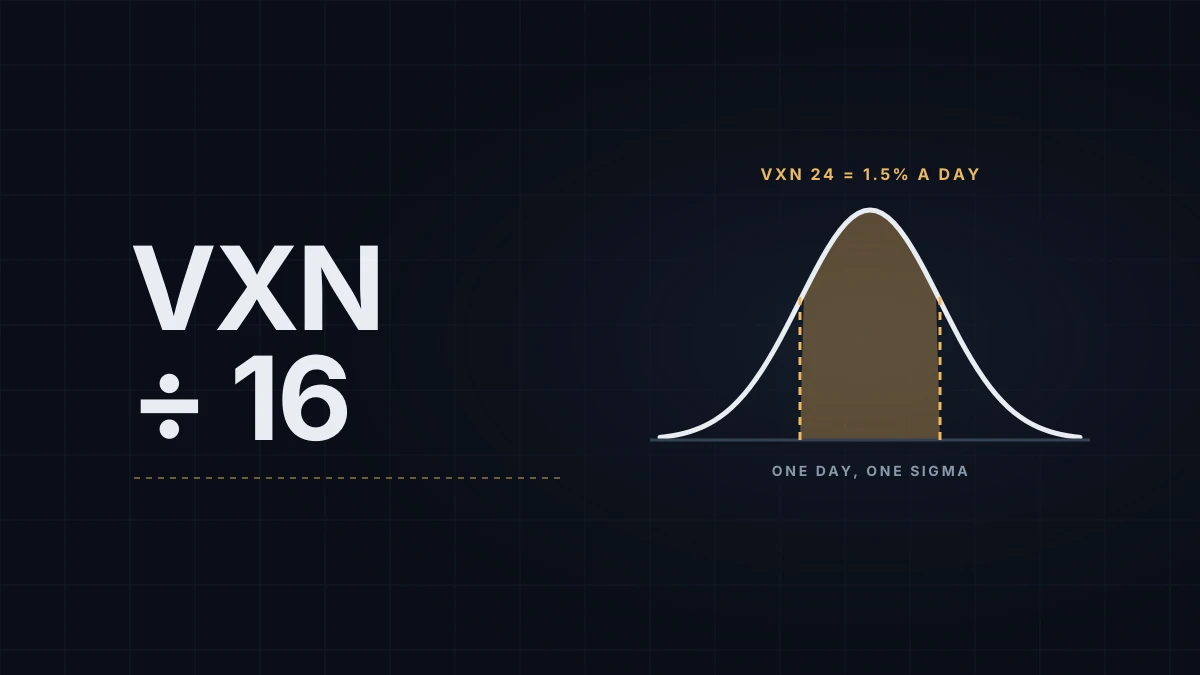
A year has about 252 trading days, and volatility scales with the square root of time. The square root of 252 is about 15.9, so traders use 16:
expected one-day move ≈ VXN ÷ 16, in percent
With VXN at 24, the expected daily move is about 1.5%. To put it in points, multiply by the index level. Using 28,000 as a round level for the arithmetic, 1.5% is 420 points, which on one NQ contract at $20 a point (see the NQ vs MNQ tick and point value guide) is $8,400. For a 30-day horizon, divide by the square root of 12, about 3.46, instead. The table divides by the exact 15.87 rather than 16, so its points run slightly above the rule of thumb.
| VXN | One day (%) | One day at 28,000 (points) | 30 days (%) |
|---|---|---|---|
| 16 | 1.0 | 282 | 4.6 |
| 20 | 1.3 | 353 | 5.8 |
| 24 | 1.5 | 423 | 6.9 |
| 30 | 1.9 | 529 | 8.7 |
| 40 | 2.5 | 706 | 11.5 |
The number is one standard deviation. If daily moves followed a normal distribution, about two days in three would close within that range of the previous close. They don't follow it exactly, which is one of the limits below.
The expected move post gets a similar number from a different source, the price of an at-the-money straddle for a specific expiration. The straddle answers "how much for this exact date"; VXN answers "how volatile are the next 30 days on average." On days with a known event, the straddle is the better guide.
VXN and VIX side by side
VXN usually sits above the VIX. The Nasdaq-100 is more concentrated in a few large technology companies and moves more than the S&P 500, so its options are more expensive. The gap itself carries information. When VXN rises much faster than the VIX, the market is worried about tech in particular; when both rise together, it's worried about everything. Checking both before the session takes ten seconds.
Where the conversion breaks down
- Implied isn't realized. VXN is what option buyers pay for protection, not what the market will do. On average, implied volatility has tended to run above the volatility that follows, because sellers of options demand a premium. A quiet market with VXN at 20 can close less than 200 points from the previous day for weeks.
- Tails are fatter than the bell curve. Days of three or four standard deviations happen far more often than a normal distribution allows. The table describes an ordinary day, not a bad one.
- It's a 30-day average. A CPI release or a megacap earnings report inside the window raises VXN for the whole month, even though the risk sits on one day. On the other days the conversion overstates the move; on the event day it can understate it.
How traders use it
Some traders use VXN as a regime label: below a level they trade their normal size, above it they cut size or widen stops, because the same number of points means less when the daily range is larger. Others compare it with the realized range from the average daily range post, keeping in mind that an average high-to-low range runs about 1.6 standard deviations, as the expected move post explains, and treat a big gap as a sign the options market expects something the chart hasn't shown yet. Neither turns VXN into a direction. A high VXN says moves will be large, not which way they'll go.
VXN is published by Cboe during US trading hours, appears on most charting platforms under that ticker, and its daily closes are on FRED as the series VXNCLS.
Educational content, not investment advice. Futures trading involves substantial risk of loss. Examples are for illustration only. Read the full Risk Disclosure.