Expected Move on NQ: Reading the Day's and Week's Range From Options Prices
The options market prices how far NQ should move today and this week. Reading it from an at-the-money straddle or from implied volatility, why the two disagree, how often price stays inside them, and why a day's high-to-low range runs about 1.6 times the one-standard-deviation move.
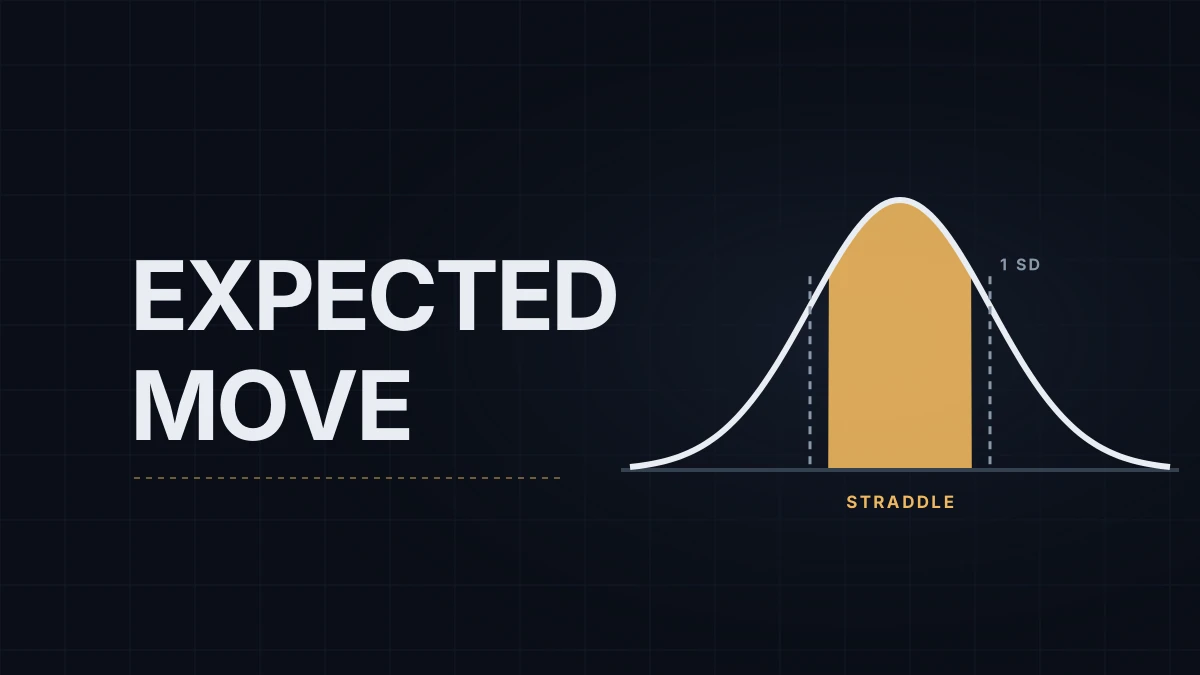
How far is NQ priced to move today? The options market answers that every morning, in two ways that give different numbers. One is the price of the at-the-money straddle on options that expire today. The other is implied volatility converted into points. Both describe the size of a move, and neither says which way it goes.
If the contract is new to you, NQ vs MNQ tick and point value covers the basics. The average daily range post already turns the VXN, Cboe's volatility index for the Nasdaq-100, into points with a table. This post adds the straddle, the probabilities behind both numbers, and the step from a day to a week.
Two ways to read it
The straddle. A straddle is a call and a put at the same strike and expiration. Bought at the money, it pays the size of the move in either direction, so its price is the market's estimate of the average absolute move until expiration. With same-day options expiring every weekday on NQ, the Nasdaq-100 index and QQQ, today's straddle prices today's move, including whatever is on the calendar. Percentages carry across those products: a straddle worth 1.0% of QQQ's price implies about 1.0% on NQ.
Implied volatility. An annualized implied volatility such as the VXN becomes a one-day standard deviation when divided by √252, the number of trading days in a year: move ≈ price × IV ÷ √252. Many brokers use calendar days instead, √(days ÷ 365). For a single day the two conventions differ by about 20%. Over a week they agree within 2%.
The two methods don't measure the same thing. For a normal distribution, the average absolute move is √(2/π), about 0.8, of one standard deviation. A fairly priced straddle therefore sits near 0.8 of a standard deviation, and dividing a straddle by 0.8 gives the one-standard-deviation move, about 1.25 times the straddle.
A worked example
On Friday, October 9, 2026, the December contract, NQ 12-26, settled at 31,108.75, and the VXN closed at 20.55. Those are the inputs the Week Ahead for October 12–16 used.
| Measure | Calculation | NQ points |
|---|---|---|
| One-day standard deviation | 31,108.75 × 0.2055 ÷ 15.87 | about 403 |
| The same, calendar-day convention | 31,108.75 × 0.2055 ÷ 19.10 | about 335 |
| Straddle that would match it | 403 × 0.8 | about 322 |
| One-week standard deviation | 403 × √5 | about 900 |
| Average high-to-low range if price moved as implied | 403 × 1.6 | about 645 |
The weekly band, 30,210 to 32,010, is the one the Week Ahead prints.
How often price stays inside
Under a normal distribution, price closes within one standard deviation 68% of the time and within the straddle, 0.8 of a standard deviation, about 58% of the time. The record sits close to the second number. Russell Rhoads, writing on Nasdaq.com, looked at one-day at-the-money Nasdaq-100 straddles priced at the previous close from January 2022 to September 2023: the index finished inside the straddle on 54.5% of the expirations he studied, and on Thursdays less than 40% of the time.
A straddle-sized band is close to a coin flip, not a two-in-three range. The numbers brokers print as "expected move" can mean either: tastylive's 85% of the straddle is about 0.68 of a standard deviation, which covers roughly half of outcomes, while its implied-volatility formula describes a one-standard-deviation move that covers about two thirds. Check which one a screen shows before using it.
Expected move and the daily range
The expected move measures where price closes relative to where it started. The daily range measures the extremes in between, and the extremes run wider. For a random walk, the average high-to-low range is about 1.6 standard deviations, twice the straddle. With the VXN at 20.55, that is a range of about 645 points on an average day.
The week of October 5 to 9 averaged 417 points from high to low. Run back through the same 1.6, a 417-point range matches a one-day standard deviation of about 260 points, a realized volatility near 13% against the VXN's 20.55. Implied volatility usually sits above realized, because option sellers charge for the days that aren't average. An implied number read straight off the screen tends to overstate a quiet week and understate a shock.
From a day to a week
Variance adds across days, so the weekly move is the daily one times √5 when every day is alike. Weeks aren't alike. A CPI morning carries more variance than a quiet Tuesday, and the options market prices that in: the straddle that expires on CPI day is wider than its neighbors, and implied volatility drops once the number is out. Say the 403 points fit the four quiet days and the CPI day carries three times their variance: the week's standard deviation becomes 403 × √7, about 1,065 points instead of 900. The VXN already spreads part of that event premium across its 30 days, so the real figure sits between the two, and the straddle that expires on Friday prices the whole week, event included, directly. For a week with a known event it's a better read than the VXN multiplied by √5.
Using the number
Traders read it in opposite ways. Mean-reversion traders treat a move beyond the day's expected range as stretched and look for fades there. Breakout traders treat a clean break beyond it as a sign of a trend day and stop fading. The number is the same; the setup attached to it differs, and neither approach works without a stop that fits the day's range.
The quieter use is scale. A level 300 points away is three quarters of a standard deviation on a 400-point day, an ordinary reach. On a 250-point day the same level is more than one standard deviation away, and planning the session around price getting there is planning for an unusual day.
Educational content, not investment advice. Futures trading involves substantial risk of loss. Examples are for illustration only. Read the full Risk Disclosure.