What Moves Nasdaq Futures: Yields, VIX, the Dollar and the NQ/ES Ratio
Yields, volatility and the dollar each move Nasdaq futures through a mechanism you can name, and each link has conditions under which it breaks; the NQ/ES ratio shows which index leads. The discounting arithmetic, what 2022 showed, what Nasdaq's research found, and how to use the four as context.
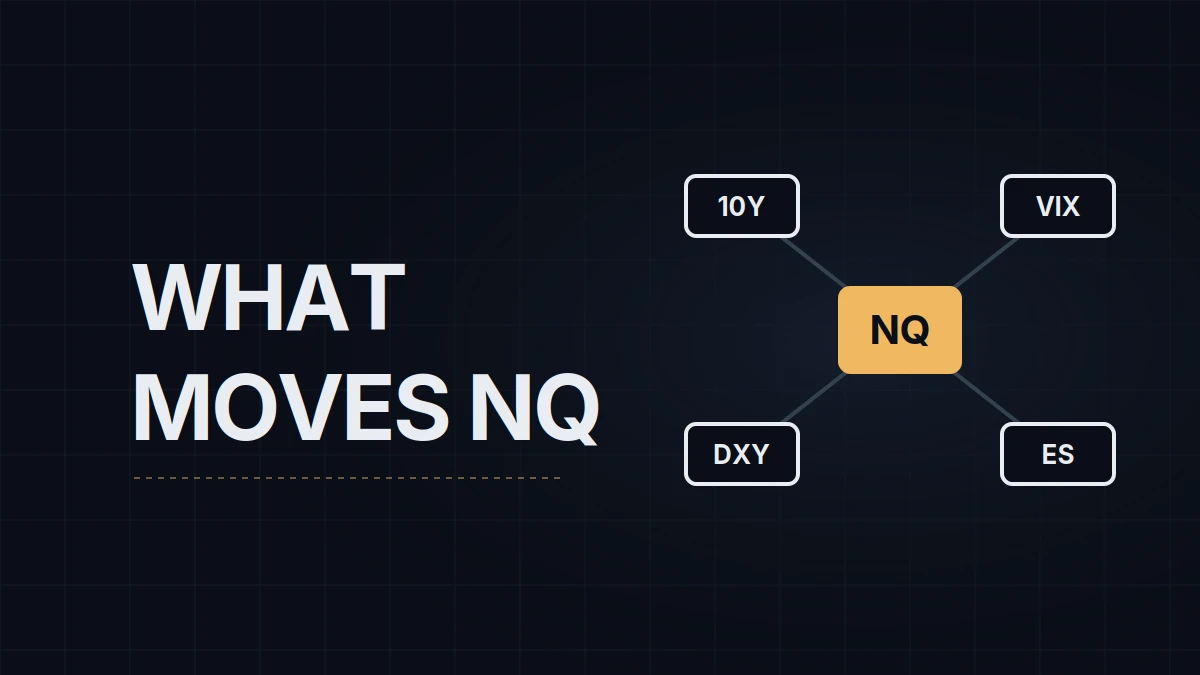
What moves Nasdaq futures on a day with no news from the companies in the index? Usually something priced somewhere else: the 10-year Treasury yield, the volatility index, the dollar, or the rest of the stock market. Each has a mechanism behind its link to NQ, the E-mini Nasdaq-100 future, and none of the links is fixed. The mechanism is what tells you when to stop trusting one. If NQ's point value is new, the NQ vs MNQ pillar comes first.
Yields
A share is a claim on a company's future profits, and what those profits are worth today depends on the rate used to discount them. The further away the profit, the more a change in that rate matters:
| $100 due in | Worth today at 4% | Worth today at 5% | Change |
|---|---|---|---|
| 2 years | $92.46 | $90.70 | −1.9% |
| 10 years | $67.56 | $61.39 | −9.1% |
| 20 years | $45.64 | $37.69 | −17.4% |
Companies whose value rests on earnings far in the future behave like the bottom row, and the Nasdaq-100 is full of them. Traders call it duration: the longer the duration, the harder a rise in yields hits the price. 2022 was the textbook case. The 10-year yield rose by as much as 2.83 percentage points, to 4.34% in October, and ended the year at 3.88%; the Nasdaq-100 fell 32.97%.
The link isn't permanent, though. Research published by Nasdaq in November 2021 found the correlation between changes in the Nasdaq-100 and in the 10-year yield slightly positive from February 1985 to June 2021 (0.08) and negative in the first ten months of 2021 (−0.20). Yields rise for two different reasons, and the reasons pull NQ in opposite directions. When yields rise because growth is picking up, earnings expectations rise with them and NQ can climb straight through it. When they rise because of inflation, or because the Fed is expected to tighten, the discounting effect wins. The economic releases post ranks the reports that move that expectation.
On a chart the 10-year yield is US10Y on TradingView. Its futures contract is ZN, the 10-Year T-Note, whose price moves opposite to the yield.
Volatility: VIX and VXN
VIX is Cboe's measure of the 30-day volatility implied by S&P 500 options, and VXN is the same measure on Nasdaq-100 options. Both usually rise when NQ falls. Falling markets raise demand for puts, which lifts implied volatility, and higher volatility makes funds that size their positions by volatility sell into the decline. The dealer side of the same flows is in the gamma exposure post.
The pattern breaks when a rally is bought with calls and NQ and VXN rise together. That is the market paying up for upside, a different kind of rally from one where volatility sinks as price climbs, and worth noticing before treating it as ordinary strength.
The dollar
A stronger dollar weighs on the Nasdaq-100 through two channels. The largest members earn a large share of their revenue abroad, and a stronger dollar turns the same foreign sales into fewer dollars. A rising dollar also tightens financial conditions for anyone outside the US who owes dollars and earns in another currency. The usual benchmark is DXY, the ICE US Dollar Index, a basket of six currencies in which the euro weighs 57.6%.
This link is looser than the yield link, and often it isn't a separate link at all: a Fed expected to tighten lifts yields and the dollar together, so part of what looks like a dollar correlation is the rate correlation seen twice. The dollar adds information on the days it moves and yields don't, as when another central bank moves its own currency.
The NQ/ES ratio
NQ divided by ES, the E-mini S&P 500, gives a line that rises when tech outperforms the broad market and falls when it lags; on TradingView it's the spread symbol NQ1!/ES1!. NQ vs ES covers how closely the two move, a correlation of 0.87 to 0.95 over a decade, and how much further NQ travels. The ratio shows what the correlation hides: which of the two is leading. A new high on NQ with the ratio at a new high is tech leading. A new high on NQ while the ratio falls means the broad market is doing more of the lifting, which is a different move from one led by the index's top ten.
The four side by side
| Market | Usual link to NQ | Mechanism | When it stops working |
|---|---|---|---|
| 10-year yield (US10Y, ZN) | Yield up on inflation, NQ down | Distant earnings discounted harder | Yields rising on growth; over decades the correlation is near zero |
| VIX, VXN | Up when NQ falls | Put demand, volatility-based selling | Rallies bought with calls |
| Dollar (DXY) | Stronger dollar, weaker NQ | Foreign revenue, tighter conditions | Often the rate link seen twice |
| NQ/ES ratio | Rises when tech leads | Relative performance | Never; it measures leadership, not direction |
Using them as context
None of the four is a trade signal. Together they show whether today's move in NQ has a cause outside NQ. When the 10-year yield and the dollar moved overnight along with NQ, the move probably has a macro cause, the kind that reaches every index at once. When NQ moved alone, the cause is usually inside the stock market, such as an earnings report, a large member or positioning, and the ratio shows whether the move is broad or narrow.
Correlations can also be measured instead of assumed. TradingView's built-in Correlation Coefficient indicator plots the rolling correlation between two symbols, and a 20-day reading says which regime holds now rather than which one held last year. It correlates closing prices, not daily changes, so a month in which yields and NQ both drifted higher reads as positive even if the yield's jumps knocked NQ down on the day they happened.
My session starts in the European morning, hours before the 8:30 AM ET (14:30 CEST) releases, and at that point the overnight change in the 10-year yield and the dollar is most of the macro news there is. Both get a look before I mark levels; neither has been the reason for a trade.
Educational content, not investment advice. Futures trading involves substantial risk of loss. Examples are for illustration only. Read the full Risk Disclosure.