Reading Your Prop Dashboard: Balance, Trailing Threshold and Why NinjaTrader Often Doesn't Show Them
NinjaTrader shows your balance. The number that ends the account is the firm's, and it reaches NT8 only on some connections. Where the trailing threshold lives (firm dashboard, R Trader Pro, Tradovate), what the NT8 column shows, and how to turn the dollar cushion into NQ points before the open.
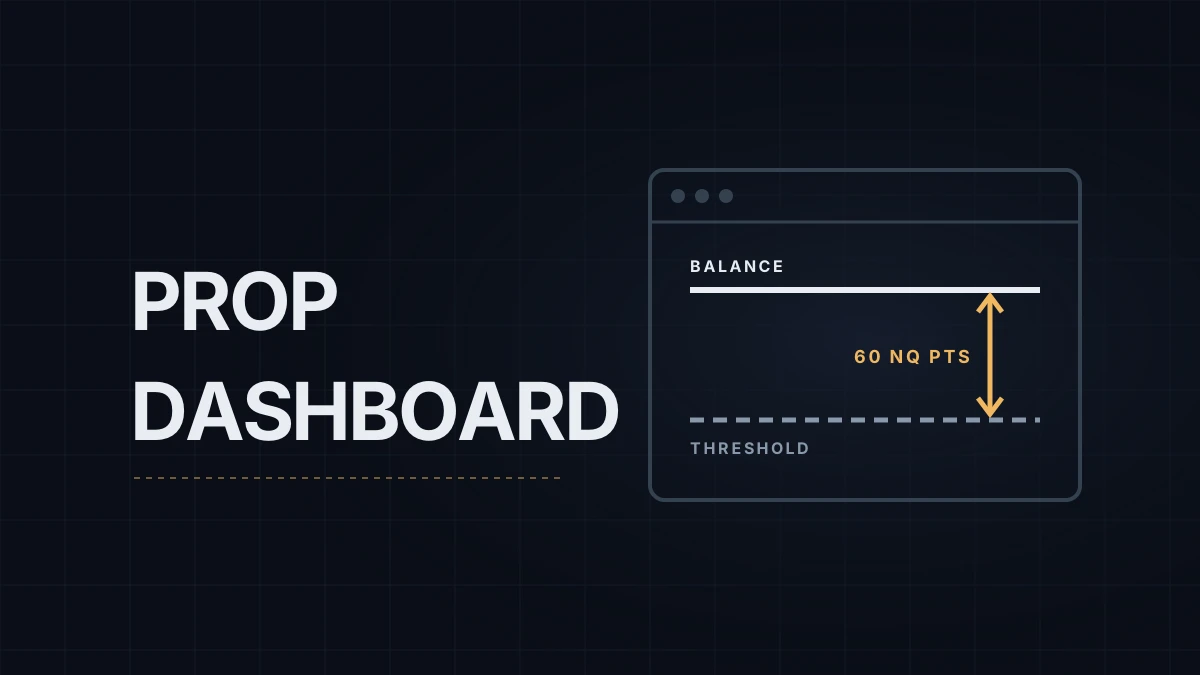
NinjaTrader shows your balance. It doesn't always show the number that ends the account. The liquidation threshold, the trailing floor, the max loss limit (every firm names it differently) is calculated on the firm's side, and on many connections NT8 never receives it. The number you need most before the open lives somewhere else.
If trailing drawdown itself is new to you, start with how trailing drawdown works and the evaluation guide. This post is about where to find the numbers once the account is live.
Why the platform often can't see it
NT8's Accounts tab in the Control Center shows what your connection sends. The connection carries orders, fills, positions and a few balance fields from the clearing side. The drawdown rule is the prop firm's own contract with you, enforced by the firm's risk system (often a Rithmic or Tradovate risk server, sometimes the firm's own software). How much the connection passes through varies: NinjaTrader's Help Guide lists only cash value, net liquidation and realized P&L for its CQG connection, with unrealized P&L added for Rithmic. Commissions in that tab come from NT8's own commission template, not from the firm, so even the net figure can differ from the firm's.
The NT8 column that only sometimes has it
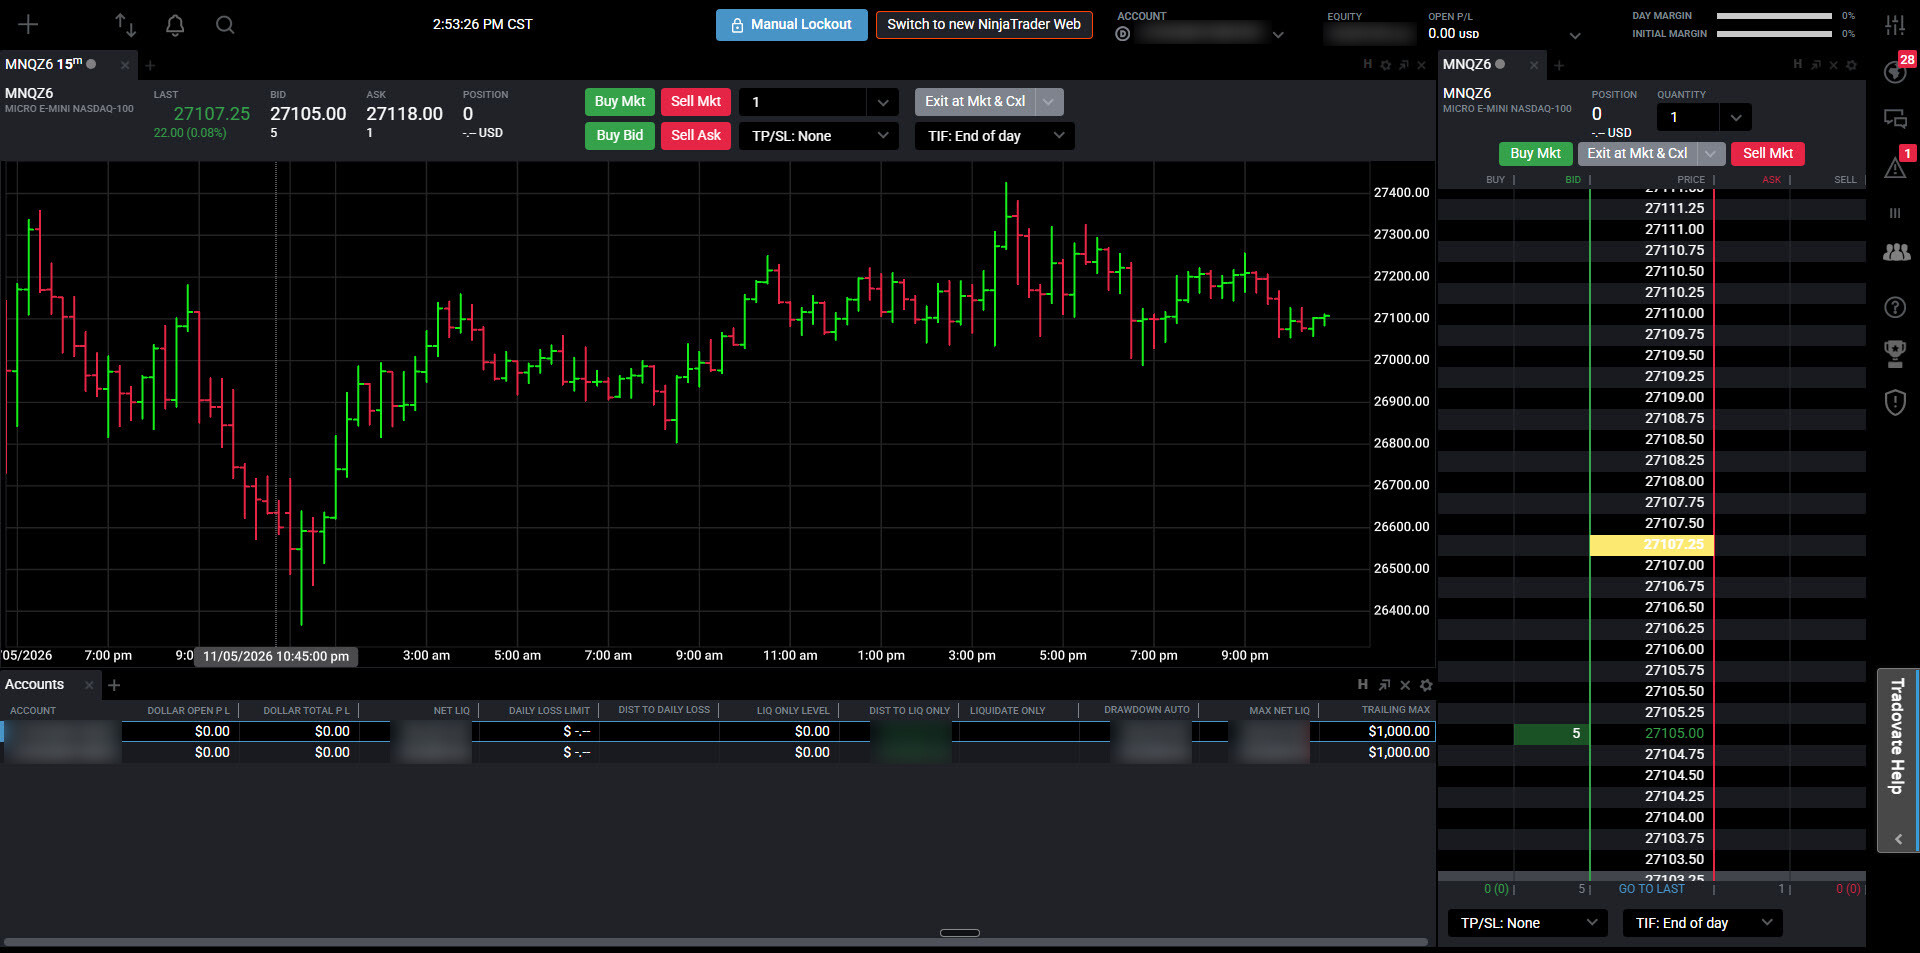
The Accounts tab has a column called Trailing max drawdown. It's a read-out, not NinjaTrader's own calculation: it shows the remaining drawdown only when the connection reports one. Some firms on the Tradovate route set their limit there and tell traders to add the column; on a Rithmic connection it has been reported to stay at zero. Check it against the firm's dashboard before you plan a day around it.
Where the threshold does show
The firm's dashboard is the source of truth. It shows the current balance, the threshold and, on end-of-day accounts, the highest closing balance the threshold trails from.
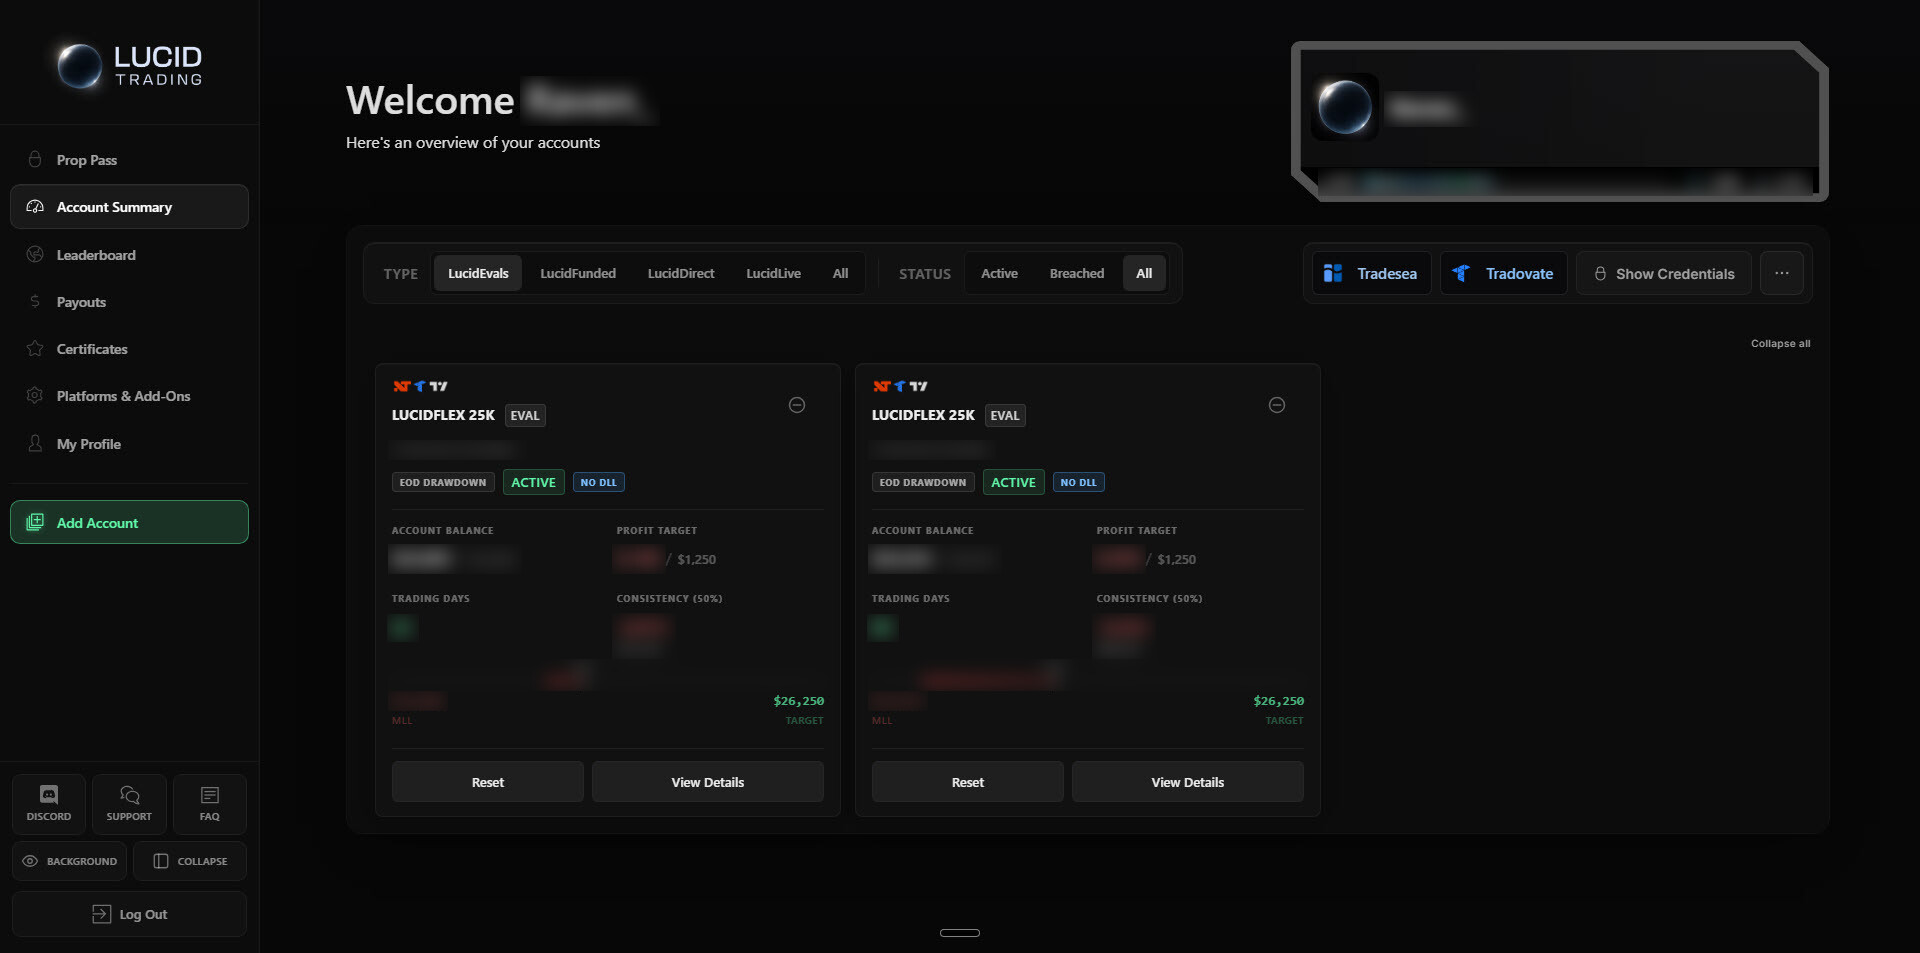
As an example of what the dashboard reflects: on a Lucid 50K funded account (LucidFlex or LucidPro) at the time of writing, the max loss limit is $2,000 below the highest end-of-day balance. It trails until the closing balance reaches $52,100, then locks at $50,100 and stays there. The dashboard updates that floor after the close, not during the day.
R Trader Pro, if your account runs on Rithmic, shows the liquidation level the risk server enforces. Take Profit Trader's help pages, for one, point traders to the "Auto Liquidate Threshold Value" field. That figure comes from the same server that will flatten you, so it's the closest thing to a live view.
Tradovate's web platform, which some firms list as their CQG route, shows a drawdown liquidation level and the remaining distance to it as columns you can add to the account view.
On most end-of-day accounts the floor moves only after the close, but it's enforced against your live equity during the day, open trades included. Read your firm's wording on that point once and write it down.
Turn the cushion into points
A dollar figure is hard to use mid-trade. Points at your size are easy. Subtract the threshold from your balance and divide by what a point is worth at the size you trade:
| Cushion | 1 MNQ ($2/pt) | 2 MNQ ($4/pt) | 1 NQ ($20/pt) |
|---|---|---|---|
| $1,200 | 600 points | 300 points | 60 points |
| $600 | 300 points | 150 points | 30 points |
Sixty NQ points can disappear in a minute after a data release. Six hundred MNQ points almost never do. Same account, same dollars, a different day. The MNQ or NQ guide goes deeper on that choice.
A two-minute check before the open
- Open the firm's dashboard and note balance and threshold. If your platform shows a liquidation level (R Trader Pro, Tradovate, or the NT8 column when your connection fills it), compare the two. On an end-of-day account they should match after the overnight update.
- Convert the gap into points at today's size and write it on a note next to the chart.
- Log both numbers in your prop account tracker, so a shrinking cushion shows up as a trend, not a surprise.
Educational content, not investment advice. Futures trading involves substantial risk of loss. Examples are for illustration only. Read the full Risk Disclosure.