Order Flow Cumulative Delta in NinjaTrader 8: Session Reset, Bar Reset and Why Two Charts Disagree
Two NQ charts, the same minute, two different cumulative delta readings. Usually nothing is broken: NinjaTrader's Order Flow Cumulative Delta changes with the delta type, the reset period, the size filter and the trading hours template. How to set it up, and how to tell which setting caused a gap.
Open two NQ charts side by side, add NinjaTrader's cumulative delta to both, and at the same minute one panel can read +3,400 while the other sits below zero. Usually nothing is broken. Order Flow Cumulative Delta, the Order Flow+ indicator that keeps a running total of buying minus selling, gives a different number for every combination of a few settings, and the two charts were built with different ones.
Delta itself, contracts bought at the ask minus contracts sold at the bid, is covered in order flow trading explained. If the chart window is new, start with the NinjaTrader 8 chart setup. Volumetric bars show the same numbers inside each bar instead of as a running line, and they need the same Order Flow+ access.
Adding it to a chart
- Open the Indicators window (Ctrl+I), add Order Flow Cumulative Delta, and leave its input series on the chart's own data. It draws in its own panel under price.
- Pick the Delta type. Bid Ask counts contracts filled at the ask or higher as buying and at the bid or lower as selling; a trade between the two takes the side of the previous tick. Up Down Tick counts a trade as buying when it prints above the previous trade and selling when it prints below, and an unchanged price keeps the previous side.
- Pick the Period: Session or Bar. The next section is about this choice.
- Set the Size filter. At 0 every trade counts. A higher value leaves out trades smaller than it, so the line follows larger orders only.
- Adjust the look. The indicator draws candles, not a line: each candle has an open, high, low and close of delta, with separate colors for rising and falling candles.
Click Template at the bottom of the window and save the settings as default once they're right, so the next chart doesn't quietly start from different ones.
Session or Bar
With Session, delta accumulates from the start of the session and each candle opens where the previous one closed. That running total is what most traders mean by cumulative delta. It resets at the session break.
With Bar, every candle opens at zero. The close is that bar's delta, the high is the most positive the bar reached and the low the most negative. It's bar delta drawn as a candle, the same idea as the Delta, Max delta and Min delta rows of the volumetric statistics grid.
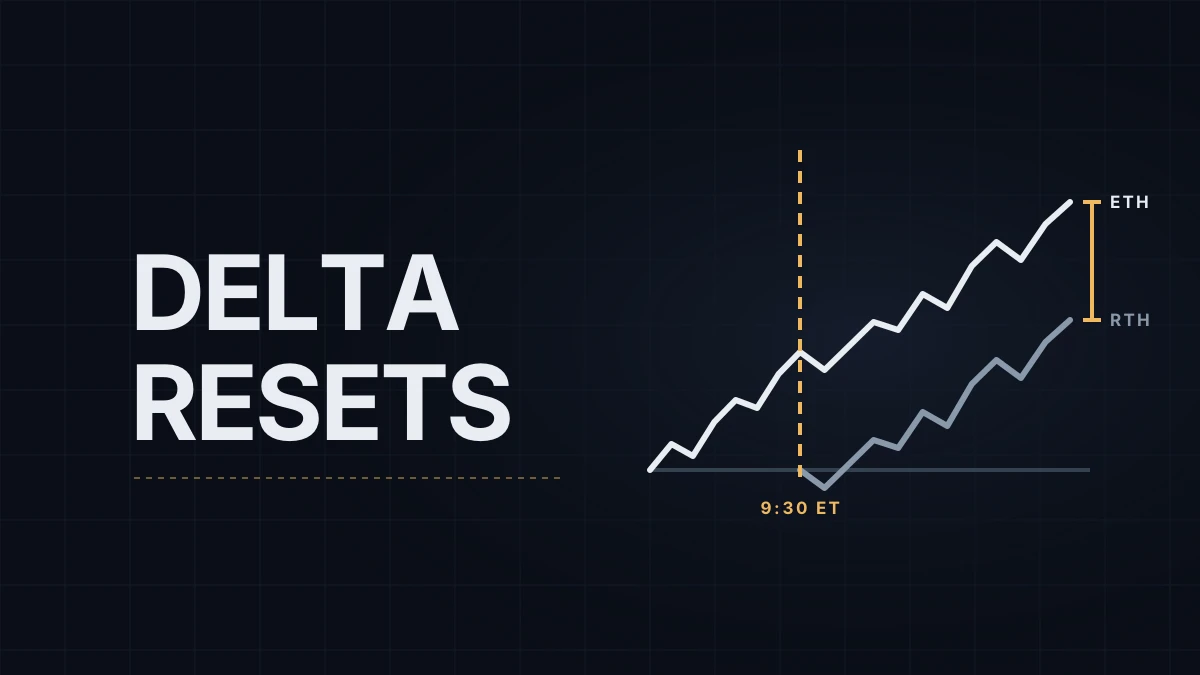
The session break is the one in the chart's Trading Hours template. With the CME US Index Futures ETH template the count starts with the Globex open at 6:00 PM ET (00:00 CEST). With the RTH template it starts at 9:30 AM ET (15:30 CEST), and everything before the US cash open is simply not on the chart.
Bar type matters less than it seems. A Range 30 chart and a 5-minute chart with identical settings reach the same running total at any given moment, because they add up the same trades. Their candles look different: a five-minute candle's high is the highest the total reached in those five minutes, and a range bar covers a different slice of time.
Why two charts disagree
| Setting or cause | What it does to the reading | How to recognize it |
|---|---|---|
| Trading Hours template (ETH vs RTH) | Moves the starting point of the count | During the US session the gap between the two panels stays constant: it's the overnight delta |
| Period (Session vs Bar) | Running total vs one bar at a time | Bar candles all start at zero |
| Delta type (Bid Ask vs Up Down Tick) | Classifies the same trades differently | The gap grows slowly and unevenly through the day |
| Size filter | Removes small trades from the count | The filtered panel sits closer to zero and jumps on large prints |
| Instrument or contract | NQ and MNQ are separate markets, and the back month trades differently around rollover | Check the instrument field first; MNQ delta is not a tenth of NQ's |
| Historical data | Bid Ask history needs historical ticks stamped with bid and ask | After a reload, the part you watched live changes shape |
The last row is the one that causes real trouble. NinjaTrader's table of data providers lists historical bid/ask tick data for the NinjaTrader connection, Rithmic and CQG, and not for Interactive Brokers, Barchart or Schwab. Barchart delivers historical ticks without bid and ask, so there a Bid Ask line is right only from the moment the chart was opened, and Up Down Tick is the setting that stays consistent. Interactive Brokers and Schwab deliver no historical ticks at all, so on those neither setting has a usable history.
Volume bars add one small, documented quirk. A single trade can be split across two or more volume bars, and the indicator's internal 1-tick series can't split it the same way: the whole trade is counted in the first of those bars, so bar-by-bar values on a volume chart can differ slightly from a time or range chart.
Two charts with the same instrument, template, delta type, period and size filter, on a provider with bid/ask history, should agree, apart from the volume-bar difference above.
History and NinjaScript
The indicator doesn't need Tick Replay. It adds its own 1-tick series in the background, which the help guide mentions when it explains the volume-bar quirk. That series makes the first load slower on long histories, so keep Days to load short on a chart that carries it.
In NinjaScript the values are DeltaOpen, DeltaHigh, DeltaLow and DeltaClose. The help guide's pattern is to add a 1-tick series with AddDataSeries(Data.BarsPeriodType.Tick, 1), call the indicator's Update() when that series updates, and read DeltaClose[0] on the primary series.
My execution chart has no order flow indicators on it, and I trade the European morning. On the RTH template the line wouldn't start until 15:30 CEST, after most of my trading day, which is why the template is the first setting I'd check on any chart that shows one.
Educational content, not investment advice. Futures trading involves substantial risk of loss. Examples are for illustration only. Read the full Risk Disclosure.