NinjaTrader Volumetric Bars: Setting Up the Order Flow+ Footprint for NQ
Volumetric bars are NinjaTrader's footprint chart: every bar split into price rows with the contracts traded at the bid and at the ask. The setup for NQ, the ticks-per-level setting that keeps them readable, what BidAsk, Delta, imbalances and the statistics grid show, and what the history needs.
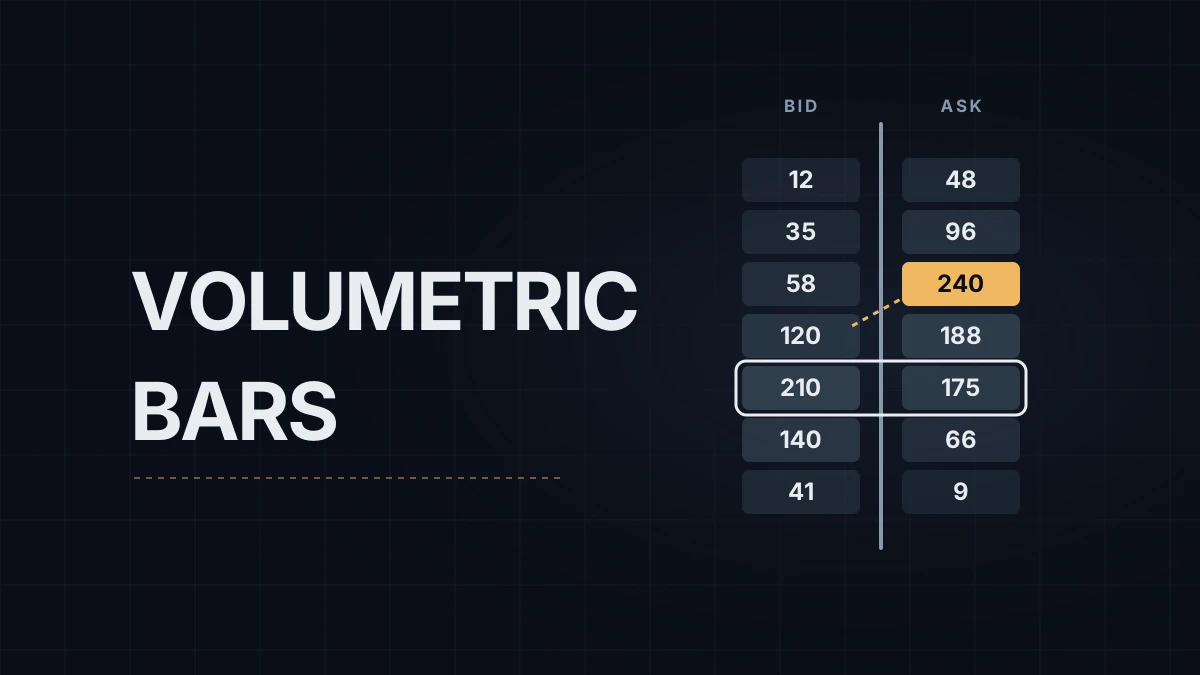
Volumetric bars are NinjaTrader 8's footprint chart. Each bar is split into price rows, and each row shows how many contracts traded at the bid and how many at the ask while price was there. They come with Order Flow+, so they work only on platforms that have it; the license post sorts out who does, prop accounts included.
If the chart window itself is new, start with the NinjaTrader 8 chart setup. Order flow trading explained covers what bid volume, ask volume and delta mean. This post is about getting NinjaTrader to show them on NQ and MNQ, the E-mini and Micro E-mini Nasdaq-100 futures.
Set up the data series
- Right-click the chart and choose Data Series, or press Ctrl+F. Select the contract you trade, for example
NQ 12-26. - Change Type to Order Flow Volumetric. The fields underneath switch to the volumetric ones.
- Pick the bar underneath with Base period type and Base period value. Tick, Volume, Second, Minute and Range all work; Renko isn't on the list. The base decides where each bar starts and ends, so a Range base builds bars the way a range chart does and then splits each one into rows.
- Choose a Delta type. Bid Ask counts contracts filled at the bid or lower as selling and at the ask or higher as buying; a trade between the bid and the ask goes to the same side as the one before it. UpDownTick counts a trade as buying when it prints above the previous trade and selling when it prints below; a trade at an unchanged price goes to the same side as the one before it.
- Set Ticks per level. The default is 1, which on NQ means one row per 0.25 point.
- Leave Size filter at 0 unless you want delta from large trades only. Trades at or below the filter drop out of the delta, and with the filter set high enough, cells start showing 0.
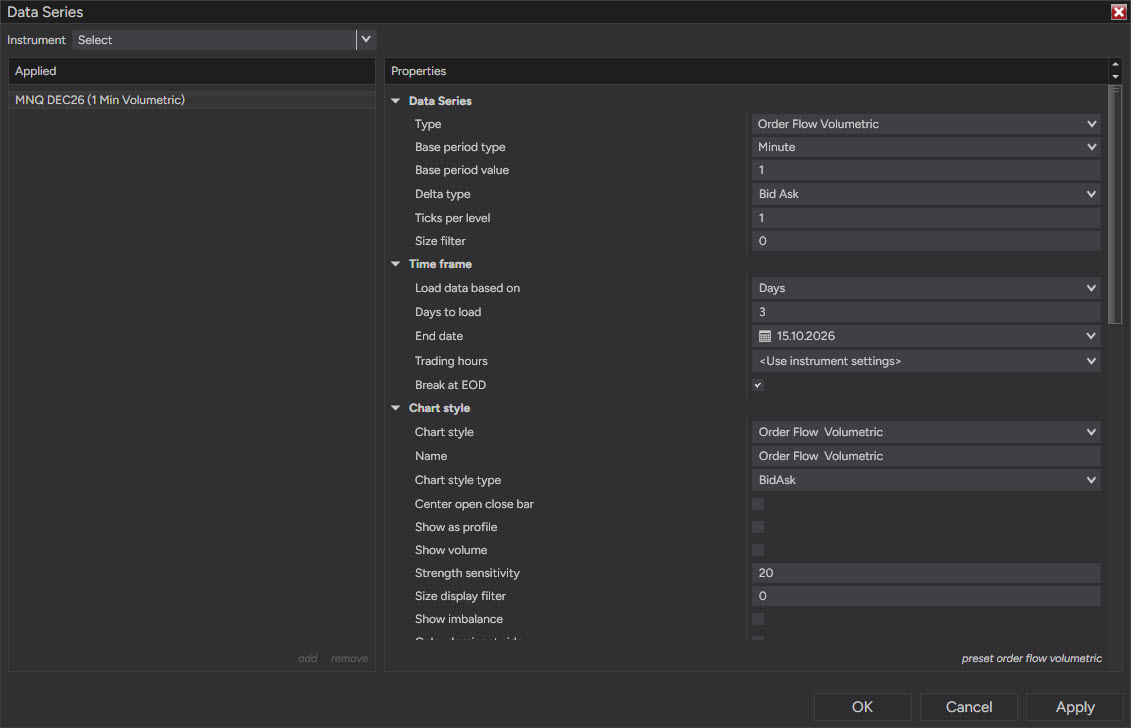
Two of those choices decide whether the chart is readable and whether its history is right.
Ticks per level works like a zoom. A 30-tick range bar on NQ covers 7.5 points, which at one tick per level is 31 rows, an easy read. A five-minute bar in the first half hour of the US session can run 60 points or more, which is about 240 rows of numbers. Four ticks per level, one point per row, or eight, two points per row, makes time bars legible again, at the cost of merging prices. When a bar's range isn't a whole number of levels, a row at the edge of the bar is a smaller remainder cell, and its numbers don't compare with a full row.
Delta type depends on your data. Bid Ask needs historical bid/ask tick data, and NinjaTrader's table of data providers says which connections deliver it: the NinjaTrader connection, CQG and Rithmic do. Barchart has historical ticks without the bid and ask, so UpDownTick is the honest choice there. Interactive Brokers and Schwab have no historical tick data at all, and volumetric bars are built from ticks, so neither delta type fills in their history.
BidAsk or Delta
Further down the same window, the Chart style section sets the look, and Chart style type has two values.
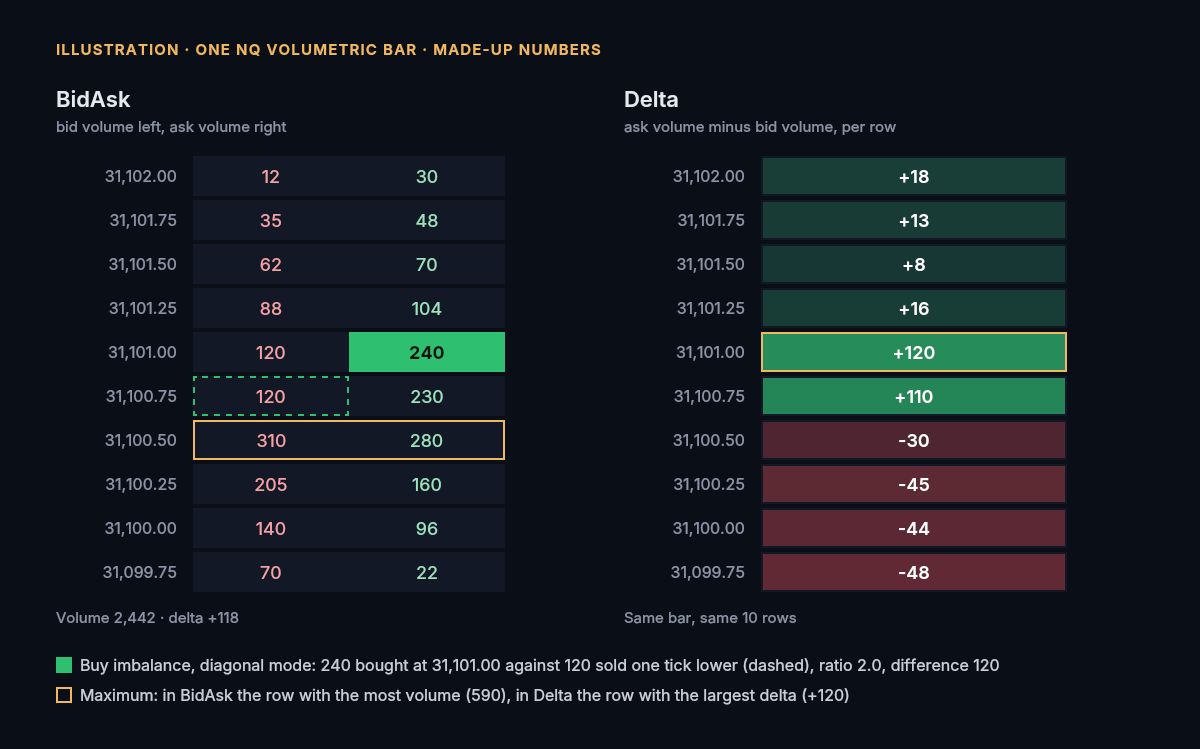
BidAsk prints two numbers in every row: bid volume on the left, the contracts sold into resting bids, and ask volume on the right, the contracts bought from resting offers. Delta prints one number per row, ask volume minus bid volume, so a row with 240 at the ask and 120 at the bid reads +120.
Three switches change what surrounds the numbers. Show as profile draws each bar's volume as a small horizontal histogram. Show volume adds a volume distribution to the right of the bar. Hide text removes the digits and marks imbalances and the maximum with colored cell borders, which helps once the chart is zoomed out too far to read numbers.
The cell shading comes from Strength sensitivity, the number of gradient steps used for buy and sell strength (20 by default, recalculated at every session break), and from Color dominant side (BidAsk only), which shades only the winning side at each price. Show maximum highlights the row with the most volume in the bar, the bar's own point of control; in Delta style it marks the row with the largest delta in either direction.
Imbalances
Imbalances work only in BidAsk style. Show imbalance turns them on, Imbalance ratio (1.5 by default) sets how lopsided a comparison must be, and Minimum delta for imbalance (10 by default) sets the smallest difference in contracts that counts. Imbalance mode chooses what gets compared.
Diagonal mode compares the ask volume at one price level with the bid volume one level lower, one tick at the default setting. The reason is the quote itself: the best bid and the best offer sit one tick apart, so a buyer lifting the offer at 31,101.00 and a seller hitting the bid at 31,100.75 are trading against the same quote. With 240 bought at 31,101.00 and 120 sold at 31,100.75, the ratio is 2.0 and the difference is 120, so 31,101.00 gets the buy imbalance color. Horizontal mode compares the bid and the ask at the same price instead.
When an imbalance and the maximum land on the same cell, only the maximum is shown.
Three or more imbalances on consecutive rows, all on the same side, are usually called a stacked imbalance. NinjaTrader has no setting for stacks; you spot them on the chart or add a third-party indicator. Traders read them in opposite ways. Some treat a stack of buy imbalances as a zone that should hold if price comes back to it. Others read the same stack at the top of a long run as buyers spending themselves. The footprint alone won't tell you which reading fits the day.
The statistics grid
Show bar statistics adds a grid under the bars with one column per bar. Tick the rows you want in the Data Series window, or switch them on and off later by clicking their labels on the right price scale.
| Row | What it counts |
|---|---|
| Trades | Number of trades in the bar |
| Volume, Buy vol, Sell vol | All contracts, and the parts filled at the ask and at the bid |
| Delta (bar), Delta (%) | Buy volume minus sell volume, in contracts and as a share of the bar's volume |
| Cumulative delta | Running total of delta, reset each session |
| Min delta, Max delta | The lowest and highest delta reached inside the bar; a strong up bar can have a positive minimum |
| Delta change | This bar's delta minus the previous bar's |
| Delta SH, Delta SL | Delta since price last touched the bar's high (usually negative) and its low (usually positive) |
The grid makes a bar that closes up on a negative delta easy to spot. Its limit is that a bar's delta depends on where the bar was cut, so the same minutes print different numbers on a Range chart and on a five-minute chart.
History, Playback and code
Volumetric bars build from historical tick data and don't need Tick Replay; that checkbox matters only to indicators and strategies that calculate on every tick. The price is load time, because a few weeks of NQ ticks is a lot of data. Keep Days to load short on a footprint chart, and if it stutters, NinjaTrader 8 lag lists the usual causes.
In Market Replay, the default Playback mode loads the chart's history from regular historical data and uses the replay file only from the start point forward, so the bars before the start point are only as good as your provider's historical bid/ask ticks. Playing back Historical data that has no bid/ask stamped ticks is worse: NinjaTrader sets the bid and ask to the last price or one tick either side, at random, and BidAsk numbers built on that aren't real.
For NinjaScript, the same data sits in VolumetricBarsType: BarDelta, GetAskVolumeForPrice() and GetBidVolumeForPrice(), indexed by CurrentBar rather than by bars ago.
When something looks wrong
- An Order Flow+ error when the chart opens. The platform has no Order Flow+ access. Close the window, or add the access and log in to NinjaTrader again, since a new entitlement takes effect only in a fresh session.
- History that disagrees with live bars. The provider has no historical bid/ask data; on a feed like Barchart, switch Delta type to UpDownTick.
- Rows of zeros. Size filter is set too high.
- A wall of digits. Raise Ticks per level, or turn on Hide text.
My execution chart stays close to bare: Range 30 bars, the day's levels and one moving average I rarely use on its own, with no footprint on it.
Educational content, not investment advice. Futures trading involves substantial risk of loss. Examples are for illustration only. Read the full Risk Disclosure.