Order Flow Basics: What Delta, Absorption and Imbalance Mean and Where They Mislead
A trade prints at the ask when the buyer was in a hurry and at the bid when the seller was. Delta, footprint imbalances and absorption are three ways of counting that, and all three are silent about the side that decides. What the numbers mean on NQ, one footprint bar read cell by cell, four lies.
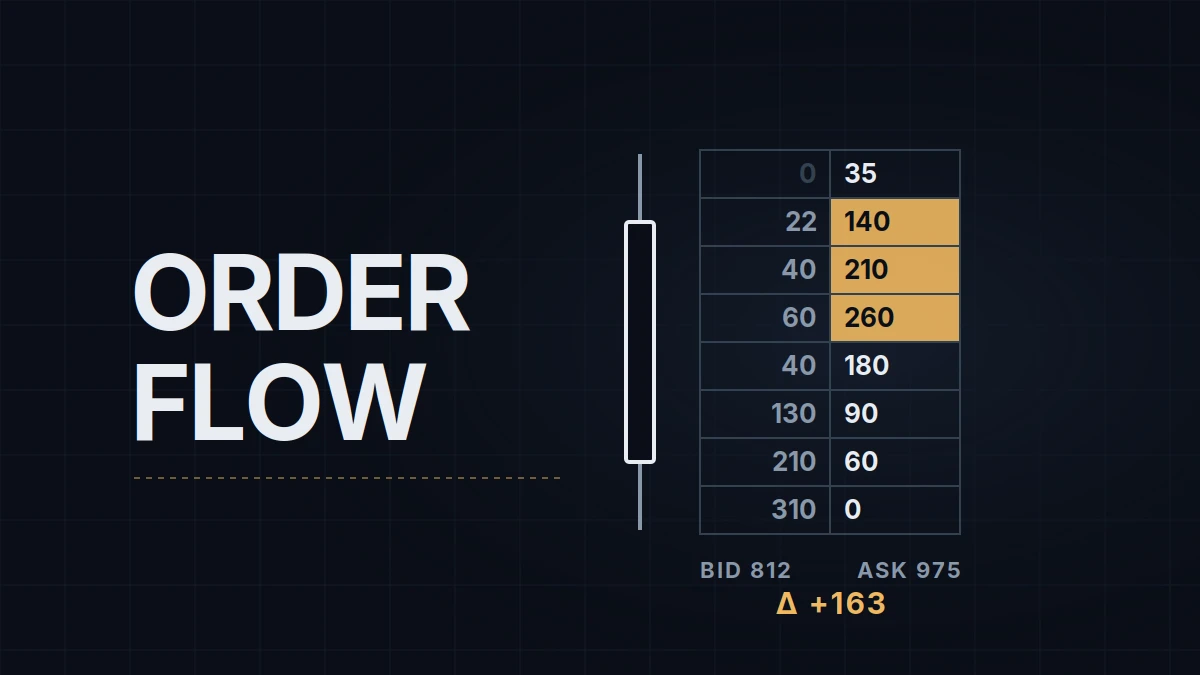
Every trade on CME is a match between someone who waited and someone who didn't. A limit order rests on the book at the bid or the ask; a market order, or a limit priced to cross the spread, arrives and takes it. The trade prints at the ask when the arriving order was a buy and at the bid when it was a sell, and that one bit, which side gave in, is the raw material of order flow analysis. Volume says how many contracts traded at a price; the bid/ask split says which side had to reach for them. Delta, imbalance and absorption are three pieces of arithmetic on that split. This post is about what they mean on the E-mini Nasdaq-100 and where they lead a trader wrong; it assumes what volume measures in futures and stops short of tool setup.
Delta
Delta is ask volume minus bid volume over a window. A one-minute bar in which 1,200 contracts traded at the ask and 800 at the bid has a delta of +400: the aggressive side was buyers, by 400 contracts. The window can be a bar (bar delta), one price inside a bar (the cells of a footprint), or the session from its open (cumulative delta, a running total drawn as a line under the chart). The sign says who was impatient, and the size says by how much.
What delta does not say is who was right. Every aggressive buyer bought from a passive seller, so the market is never net long or net short; +400 means 400 more contracts were bought by people in a hurry than sold by people in a hurry. If price rose 6 points on that bar, the hurried buyers got what they paid for. If it didn't move, or fell, they bought from a seller who didn't need to hurry, which is a different event and has its own section below.
The reading most traders use is delta divergence: price makes a higher high, cumulative delta makes a lower high. The second push reached a higher price with less aggression than the first, which is the order flow version of a momentum divergence and carries the same caveat: it describes a weakening, not a turn, and it can persist through three more highs.
Footprint bars and imbalance
A footprint bar (NinjaTrader's name is Volumetric bar) shows, for each price a bar traded at, the volume at the bid on the left and at the ask on the right. Reading down a bar gives delta per price; the totals at the bottom give the bar's delta.
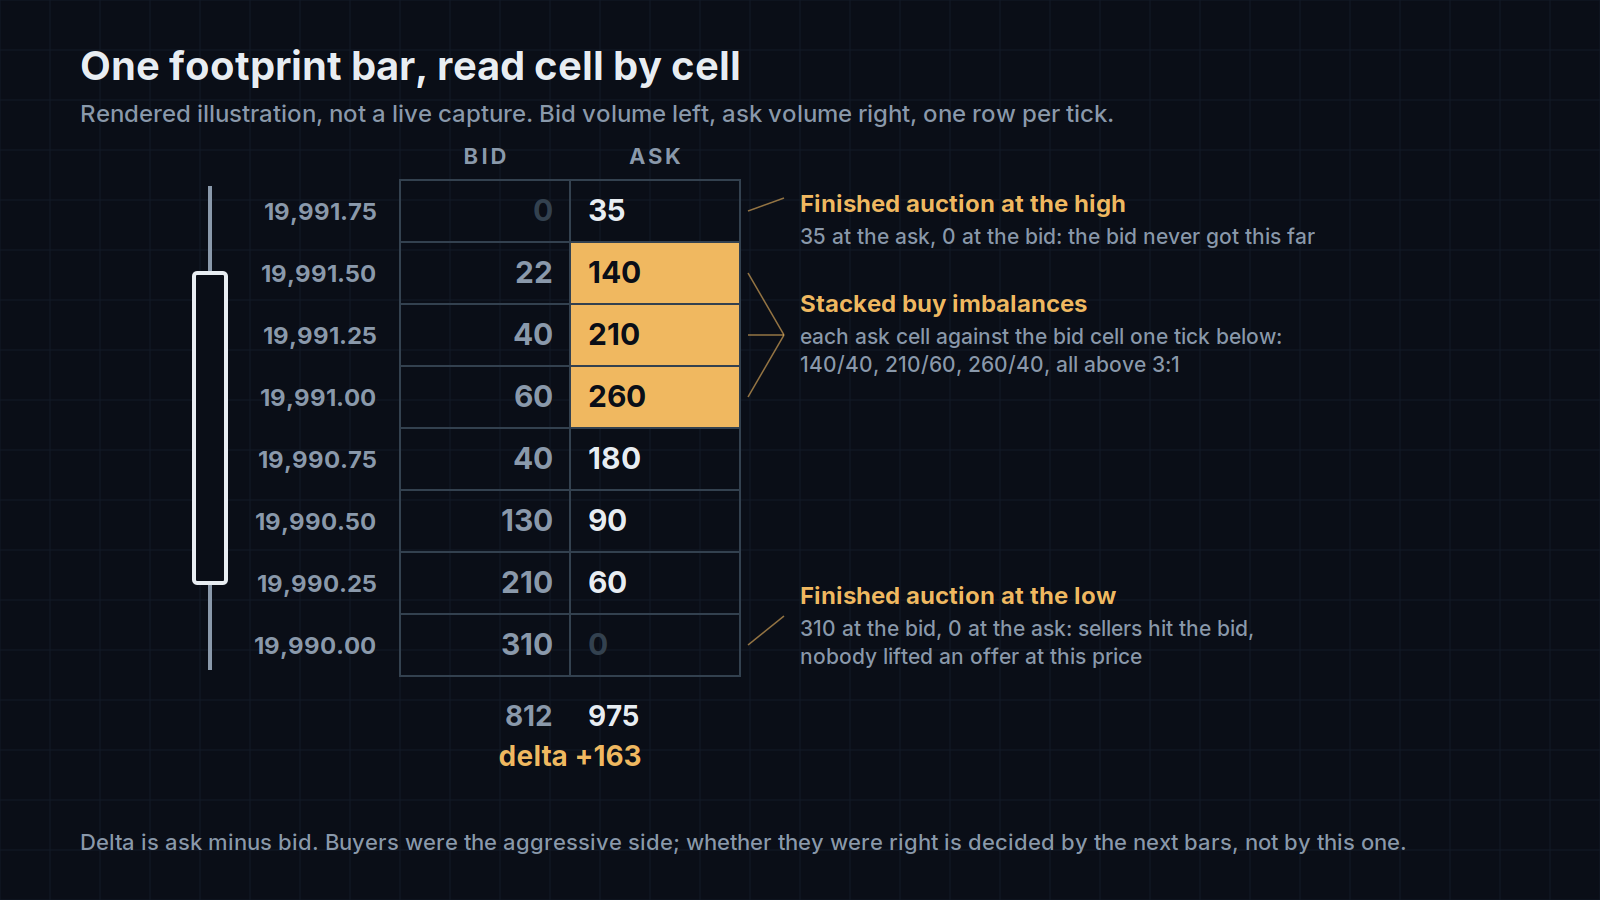
An imbalance is one price where one side outweighed the other by a set ratio, and it is measured diagonally, not across the row: ask volume at one price against bid volume one tick lower. The reason is that those two cells describe the same moment. When the market is 20,000.00 bid and 20,000.25 ask, an aggressive buyer trades at 20,000.25 and an aggressive seller trades at 20,000.00; comparing the ask cell to the bid cell one tick below compares the buyers and the sellers who were competing for the same quote. The ratio is a setting: NinjaTrader's Volumetric bars default to 1.5:1, and 3:1 is a common stricter choice. On the bar above, 260 contracts at the ask against 40 at the bid a tick lower is a buy imbalance at 6.5:1. Three or more on consecutive prices are stacked imbalances, prices where one side kept pushing through the other, and footprint traders use them as small support and resistance inside the bar, which is a finer-grained version of why any level holds.
The bar's extremes carry a second tell. At the top of the bar, a finished auction prints ask volume and a zero on the bid: buyers lifted the offer there and the bid never got that high. A top with volume on both sides is an unfinished auction, a price the market quoted and didn't reject, and footprint traders expect it to be revisited. It is a tendency, not a rule.
Absorption and exhaustion
Absorption is heavy aggressive volume on one side at a price that does not move. Fifteen hundred contracts sold at the bid at 19,990.00 over four minutes, and the bid is still 19,990.00: sellers hit it and it refilled. On a footprint it is a bid cell with a very large number and the next bars' lows at the same price; on cumulative delta it is a line falling while price is flat; on a heatmap it is a run of sell dots into a bid that does not shrink. Absorption is the order flow event a level trader waits for, because it is the level being defended, live and with size, which is the only evidence a line on a chart ever gets.
Exhaustion is the opposite: volume that thins out at the extreme. Price pushes to a new high on 30 contracts where the previous push traded 400, and the buyers who made the last high are not there for this one. Both patterns are read at extremes, both need a reference (a level, a prior swing) to mean anything, and the two of them appear in nearly every school's playbook under different names.
Four ways the numbers lie
- The passive side is invisible, and it decides. Delta counts aggression only. +2,000 into an ask that keeps refilling is not 2,000 contracts of buying pressure; it is 2,000 contracts of buyers absorbed by a seller with more. The same delta is bullish in a rising market and a trap at a wall, and the number cannot tell the two apart. Price and the book can.
- The feed decides what a bid trade is. Delta depends on tick data that carries the bid and ask at the moment of each print. Feeds differ: some deliver every trade with its quote, some aggregate trades, and platforms fall back to classifying by up-tick or down-tick when the quote is missing, which is why volumetric bars from two feeds show two deltas for the same bar. Compare delta within one platform on one feed; a number quoted from a different feed is a different number.
- Size means nothing without the hour. A +600 bar at 4:00 AM ET / 10:00 CEST on a few hundred contracts is a large share of a thin market; the same +600 at 9:31 AM ET / 15:31 CEST on 20,000 contracts is rounding. Reading delta in contracts across the session windows compares markets that differ tenfold in depth; delta as a share of the bar's volume travels better.
- The move often starts somewhere else. NQ is moved by ES, by the cash index and its largest components, and by options hedging, and the first NQ delta of a move is a reaction to a print somewhere else. A stack of buy imbalances on NQ that gets run over a minute later wasn't wrong about NQ. It was the last to know.
A fifth, smaller one: cumulative delta is only as good as its reset. Start the count at the Globex open and the number at 9:30 AM ET / 15:30 CEST includes the overnight; start it at the cash open and the overnight is gone. The two lines diverge from the first bar and both are correct.
Which tool shows which
| Tool | Shows | Doesn't show |
|---|---|---|
| Footprint / volumetric bars | Bid and ask volume per price, bar delta, imbalances | The resting book; anything that didn't trade |
| Cumulative delta | The session's aggression as one running line | Where in price it happened |
| Volume profile | Volume by price over a period | Which side traded it |
| DOM / SuperDOM | The resting book right now, ten prices each side | History; the book from a minute ago |
| Heatmap | The resting book over time, trades as dots | Stops, intent, the other markets |
In NinjaTrader 8 the footprint and the cumulative delta line come from the Order Flow+ package, which at the time of writing comes with every funded NinjaTrader brokerage plan, with some prop-firm logins, Lucid's among them, and as a $59-a-month add-on otherwise. The setting worth knowing is Delta type, Bid/Ask or Up/Down tick, which is lie number two in a dropdown: Bid/Ask needs historical tick data stamped with the quote from your provider, and without it the platform can only classify by tick direction. The heatmap is a separate program with its own post; how to set it up for NQ is a Tools post of its own.
I keep the execution chart bare, no footprint, no delta line, and read order flow in a separate Bookmap window only at levels marked before the session. It works as a veto: absorption at the level says the trade is live, its absence says wait. As an entry signal on its own, at a price where I had no reason to expect a reaction, delta has never paid for itself, which is a common experience and the reason most order flow teaching starts with the words "at a level".