NQ Week Ahead (Sep 7–11, 2026): CPI, the Fed Blackout and the September Roll
The Fed went quiet on Saturday and stays quiet through CPI. That leaves Thursday's PPI and Friday's CPI to price the September 16 decision alone, with the NQ contract roll landing in between. Where last week's map held, where it didn't, the levels I've marked and how the European session lines up.
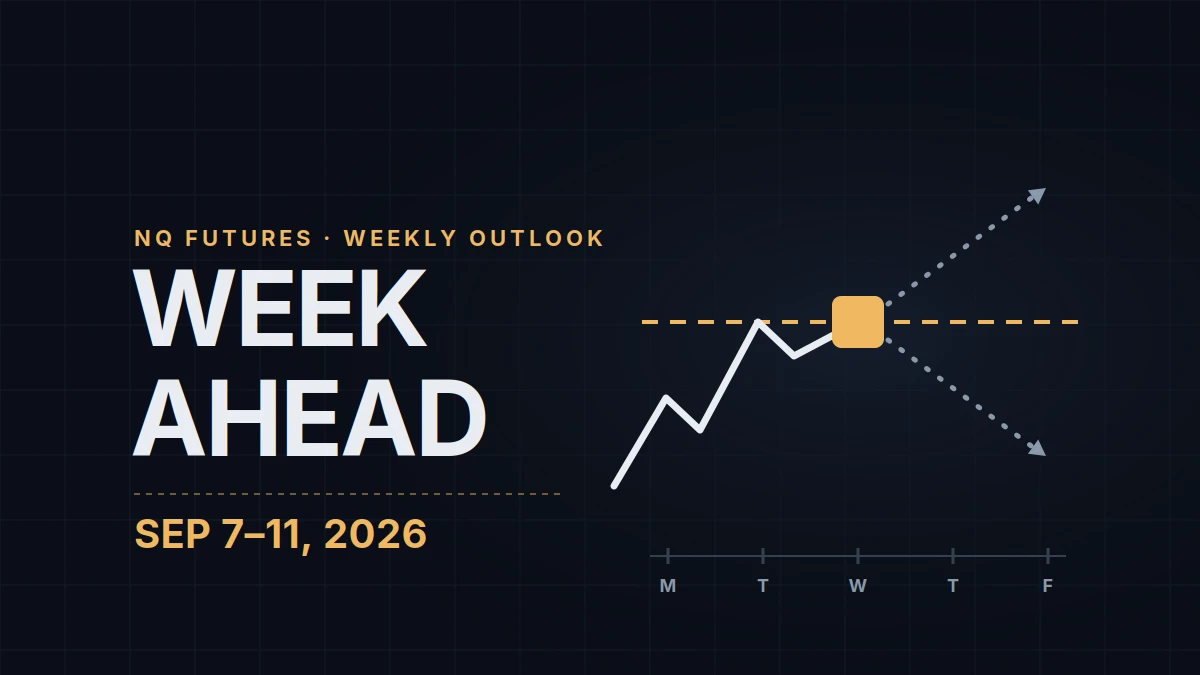
Week four of the series: where the market stands, what's on the calendar, and the levels I'm working with going into the week.
Four sessions, two inflation prints, no Fed speakers.
The last part is new. The Federal Reserve's pre-meeting quiet period began on Saturday, September 5, and runs through September 17, so for the first time since this series started nobody from the Fed will be on a podium translating the data before the September 15–16 FOMC meeting. Thursday's PPI and Friday's CPI, the producer and consumer inflation prints for August, land into silence and the rates market prices them by itself. Fed funds futures closed Friday at a 58% probability of a 25-basis-point hike on September 16 (CME FedWatch); a hot CPI makes that close to certain, a soft one drags it back to a coin flip.
Add the September contract roll on Thursday and the E-mini Nasdaq-100 (NQ) has a week where the calendar matters more than the chart. Monday is Labor Day: US cash markets are closed, Globex equity futures halt at 1:00 PM ET / 19:00 CEST, and the real week starts Tuesday.
Last Week, Scored
The Aug 31–Sep 4 map had a fight zone, a flip level and a place to look for buyers. Here is how each one held up.
| From last week's post | What the market did |
|---|---|
| 29,300–29,400 — "where I expect the fight" | No fight. Monday's Iran headlines and Tuesday's bond selloff went through it with barely a pause. |
| 29,225 — prior-week POC, "lose it and the map flips" | Lost early. The map flipped. |
| 29,000 / 28,946 — "first place I'd look for responsive buyers" | Buyers showed up. The week's low printed around Wednesday's open and saw no follow-through. |
| 29,550–29,700 — the 2026 point-of-control zone | Reclaimed on Wednesday's bounce and Thursday's Waller rally. |
| 29,800 — "the tell" | Never reached. Friday's high stopped at 29,700 and reversed. |
The locations were right, the hold call was wrong for the second week running, and the tell went untested. Two weeks in a row the downside path has traded to its level and the upside path has stopped one rung short. That says something about the range and nothing about my bias, and I'm trying to keep it that way.
What Carried Over
The week closed almost where it opened, which hides how much moved underneath. Renewed US–Iran strikes put Brent above $90 on Monday, the bond selloff ran through Tuesday, and on Wednesday the 10-year Treasury yield printed 4.818%, its highest since November 2023, with the 30-year above 5.24%. Then Governor Waller said on Thursday that if the next two weeks of data keep showing disinflation he'd support leaving rates at 3.50–3.75% ("give disinflation a chance"); hike odds fell from 63% to 48% in a session, the 10-year dropped to 4.75% and the Nasdaq gained about 1.4%. Friday's payrolls did the reverse: +162,000 jobs against roughly 55,000 expected, unemployment steady at 4.1%, prior months revised up by 55,000. Hike odds went back to 58%, the 2-year to 4.37%, its highest since January 2025, and the Nasdaq gave back 0.3%.
Oil never came back down. WTI settled Friday at $91.48, up almost 10% on the week, its strongest weekly gain since July; Brent settled at $92.68 after its own contract roll, up about 7.6% like for like. US diesel hit a record $5.82 a gallon on Thursday. Energy feeds headline CPI directly and the core number with a lag, so a hot Friday print would surprise nobody who has watched the pumps.
Yields didn't either. The 10-year closed the week near 4.78%, within five basis points of Wednesday's high, and the Treasury now sells $58 billion of 3-year notes, $39 billion of 10-year notes and $22 billion of 30-year bonds into that. A poorly received 10-year auction on Wednesday can move NQ before CPI gets its turn.
The AI trade is still doing the offsetting, with less margin for error. Broadcom grew revenue 86% year over year to $29.6 billion, AI chip revenue 221% to $16.7 billion, and put a $230 billion number on fiscal 2028 AI sales; the stock still closed flat to lower, because the $34.8 billion fourth-quarter guide came in a touch under consensus. Dell jumped almost 16% on a raised full-year outlook; Snowflake gapped up more than 20% on the same kind of news. On Friday semiconductors rose about 2.7% while software fell about 2%, inside an index that closed flat. NQ inherits both halves of that trade.
Where Price Closed
NQ finished the week back inside the 2026 high-volume node, a few dozen points from the year's point of control (POC, the price with the most volume traded this year, ≈29,575 on my profile at the time of writing; the key levels post covers the whole volume-profile vocabulary). It printed a new weekly low on the way there. On the daily chart the 5-, 20- and 50-day moving averages sit stacked inside the node and the Bollinger Bands are narrowing again.
A lower low that leads nowhere is one of the more useful things a market can print. Sellers got their break and couldn't sell it; buyers got their reclaim and couldn't extend it past 29,700. The range is three weeks old now, and every tier-one catalyst this week arrives inside it.
Levels for the Week
Reading from the top. These are drawn on the September contract; read the roll note below before using any of them after Thursday.
| Level | What it is | Why it's marked |
|---|---|---|
| 30,025 | Large call wall (the strike with the heaviest call open interest above); also fills the open gap in QQQ, the Nasdaq-100 ETF | The magnet above if 29,700 goes. Not a target from inside the range. |
| 29,810 / 29,870 | The Aug 28 rejection high and the Aug 17 breakout line | First objectives above the prior-week high |
| 29,700 | Prior-week high, Friday's reversal | The line the whole week trades below |
| 29,600 | Prior-week value area high (VAH) | Acceptance above it changes the map; a wick above it doesn't |
| ≈29,575 | 2026 POC | Fulcrum of the year; the market closed on it |
| 29,450–29,500 | Thin-volume shelf that held Thursday and Friday | First place sellers have to prove anything |
| 29,400 | Just under the shelf | A break traps late buyers overhead and opens a rotation lower |
| 29,150–29,200 | Prior-week POC area | Where a rotation turns into a loss of the range |
| 29,000 / 28,927 | The round number and the reference under the last two weekly lows | Responsive buyers showed up here twice |
| 28,800 | Put wall (heaviest put open interest below), lower daily Bollinger Band and the QQQ gap near 700 | The structural floor; below it the tape can accelerate |
Above 30,025 the map continues at 30,100, 30,230 and the upper daily Bollinger Band near 30,425, overhead inventory rather than targets until price is accepted above 30,000. Below 28,800 it continues at 28,585, 28,400 and the 200-day moving average. Neither end is the base case; both are mapped.
The upside path: the shelf at 29,450–29,500 holds a test, 29,600 gets accepted rather than wicked, and 29,700 breaks on volume the range hasn't seen in three weeks. Then 29,810–29,870, then 30,025. The trade I'd be looking for is the one that worked in the second half of last week: a failed break of 29,400–29,450 that reclaims. That's Key Level Reversal (KLR), my setup: a marked level breaks, the break fails, the reclaim is the entry. The breakout of 29,700 itself isn't a KLR trade, and the first attempt at it is more likely to look like Friday than not.
The downside path: a push above 29,600, or a wick through 29,700, that fails inside the session and closes back under 29,600. Then the shelf breaks, 29,400 goes, and the rotation runs to 29,150–29,200, which is still inside the three-week range. The map only changes on acceptance below 29,000. From there 28,927 and 28,800 are live, and if 28,800 fails with the options market flipping to negative gamma (dealers hedging with the move instead of against it), the next references are 28,585, 28,400 and the 200-day.
The Calendar
Everything on the week, including the second-tier prints, is on the calendar page. What can move NQ, in ET and CEST:
| Day | ET / CEST | Event | Why it matters for NQ |
|---|---|---|---|
| Mon Sep 7 | halt 1:00 PM / 19:00 | Labor Day. Cash closed; Globex equity futures halt, reopen 6:00 PM ET / 00:00 CEST | No data, no settlement, thin tape |
| Tue Sep 8 | 1:00 PM / 19:00 | $58B 3-year note auction | First read on demand for Treasury supply at these yields |
| Wed Sep 9 | 1:00 PM / 19:00 | $39B 10-year note auction | A weak sale puts the 10-year back at 4.80% without any data |
| Wed Sep 9 | ~1:00 PM / 19:00 | Apple product event | Largest Nasdaq-100 weight; usually a fade, not always |
| Thu Sep 10 | 8:15 / 14:15, presser 8:45 / 14:45 | ECB decision, 25 bp hike to 2.50% expected | Priced in; Lagarde's tone moves Bund yields, which the 10-year follows |
| Thu Sep 10 | 8:30 / 14:30 | PPI for August, weekly claims | Pipeline inflation; the preview for Friday |
| Thu Sep 10 | 1:00 PM / 19:00 | $22B 30-year bond auction | The long end has been the problem all month |
| Thu Sep 10 | after close | Oracle, Adobe earnings | AI infrastructure demand (ORCL) and software monetization (ADBE); Friday gap |
| Thu Sep 10 | session | NQ/MNQ roll: volume moves from September (U) to December (Z) | See the roll note |
| Fri Sep 11 | 8:30 / 14:30 | CPI for August: consensus +0.4% headline, +0.2% core month over month; the Cleveland Fed nowcast sits at +0.36% / +0.20% | The decision input for September 16 |
| Fri Sep 11 | 10:00 / 16:00 | University of Michigan sentiment (prelim), with inflation expectations | Second-tier normally; with gasoline up, not this time |
Next week is the FOMC decision on Wednesday, September 16, at 2:00 PM ET / 20:00 CEST, and the September contract expires on Friday the 18th.
The Roll
Thursday is the CME roll date for the September equity index contracts. NQ 09-26 and MNQ 09-26 expire on Friday, September 18, and by convention volume moves to NQ 12-26 and MNQ 12-26 on the Thursday eight days earlier, which is September 10. From Thursday morning the December contract is the one to trade.
Two consequences for the map above. December trades at a premium to September (the calendar spread, set by interest rates and expected dividends), so every level shifts by that spread the moment you switch charts; on a NinjaTrader 8 continuous chart the stitched prices are unadjusted, so the jump shows as a visible gap instead of being smoothed away, which is what I want. And Thursday has the ECB, PPI and the roll in the same session, so liquidity is split across two contracts exactly when the data hits. New to contract months and the quarterly switch? Start with the rollover post: codes, dates, what to redraw.
Correction, October 2026: CME's roll date has been the Monday of expiration week since June 2022, here Monday, September 14; the Thursday date above is the older convention. NQ volume moved to December on the 14th and MNQ's a day later.
How I'm Trading It
Window: 09:00–15:30 CEST, 3:00–9:30 AM ET, as always.
Monday I'm not trading. Cash is closed, Globex is open with nobody in it, and a thin holiday tape at the edge of a three-week range is the kind of session where a level "works" and nothing follows. Good day for writing.
Tuesday and Wednesday belong to the auctions, and all of them print at 19:00 CEST, after my session. My hours are the setup: two-way rotation between the shelf and 29,700, with neither side committing before the 10-year sale. Apple lands after the window too.
Thursday is the day. ECB at 14:15 CEST, PPI and claims at 14:30, Lagarde at 14:45, all inside my window in a fifteen-minute stack. I'm flat from 14:10, and the first rotation after PPI is for watching, same rule as any tier-one release. It's also roll day: MNQ 12-26 opens in NT8 before the session, the profile gets re-anchored on December, the levels move by the spread. A December book that's still thin in the European morning is a reason to size down or pass, not to trade September out of habit. Oracle and Adobe report after the close, so Friday opens on a gap whichever way they go.
Friday is CPI at 14:30 CEST, an hour before I close. Flat into it by rule. A trade afterward needs price at a mapped level with a clean reaction inside sixty minutes, on a Friday, ahead of FOMC week. High bar; if it isn't met I log a no-trade day and don't argue with it.
The level I care about most is 29,450–29,500: the shelf that held twice, just under the year's POC, and the first real decision point for either a soft-PPI rally or a hot-CPI selloff. The tell above is 29,600, the prior-week VAH and the line that separates a second rejection like Friday's from a market that is done with the range.
Journal tags for the week: the gamma regime each morning (compression on the POC still reads positive, which is where KLR earns its keep; a flip after CPI is my signal to stand down), the roll-day spread, and the no-trade days logged as what they are.
Nothing here is financial advice. This is my own weekly preparation, published as-is — levels are references, not signals.
Educational content, not investment advice. Futures trading involves substantial risk of loss. Examples are for illustration only. Read the full Risk Disclosure.
Read next
NQ Week Ahead (Oct 19–23, 2026): Meta, Tesla, Netflix and the September Floor
The VXN priced a 900-point week; NQ fell 1,717 points and made a lower low every day. CPI and PPI ran hot, but the selling that didn't stop came from AI credit and chip stocks. Now almost 9% of the Nasdaq-100 reports in one Wednesday evening, with the Fed in its quiet period.
NQ Week Ahead (Oct 12–16, 2026): September CPI, Chip Earnings and the Range Under the Record
Two days after Tuesday's record at 31,616.50, a report on OpenAI's revenue took 450 points off NQ in 45 minutes. Now comes the only CPI report between the Fed's September hike and its October decision, with TSMC, ASML and the first big banks of earnings season around it.
Nasdaq Record High: Payrolls, Nvidia and the Narrow Rally Behind NQ's New High
The Nasdaq-100 set a record close of 31,076 on October 5, 2026, after weak payrolls cut the odds of an October Fed hike and Nvidia pushed toward a $6 trillion value. Under the surface, new 52-week lows outnumbered new highs and the 10-year yield sat at its highest since 2002.