Cumulative Volume Delta on NQ: What CVD Measures, Divergences and Why Settings Change the Story
Price makes a higher high and cumulative delta doesn't. That divergence is the most quoted read in cumulative delta trading, and it has at least four explanations pointing different ways. What CVD measures on NQ, what its level and slope mean, and which settings create or erase a divergence.
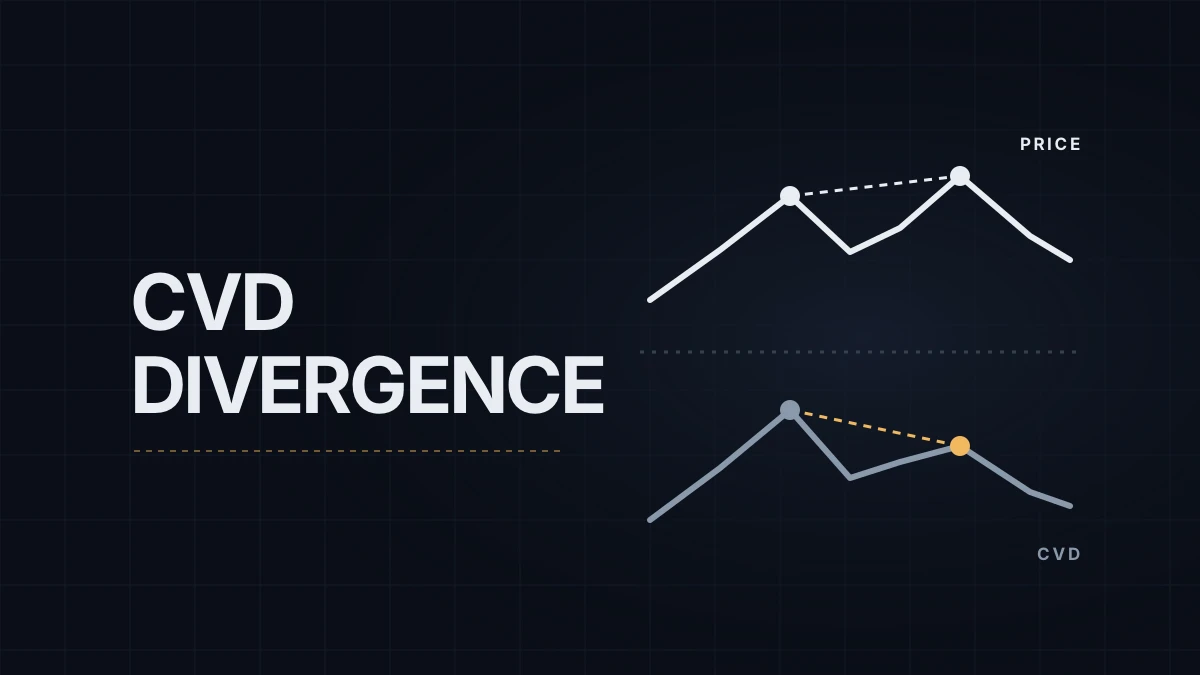
Price makes a higher high and cumulative delta doesn't. That picture, a CVD divergence, is the most quoted read in cumulative delta trading, and it has at least four explanations, two of which don't point toward a reversal at all.
Cumulative volume delta (CVD) is a running total of delta: contracts bought at the ask minus contracts sold at the bid, added up from a starting point the trader picks. On NQ, the E-mini Nasdaq-100 future, it's built from the same trades as the contract's price and volume. Delta, absorption and exhaustion are defined in order flow trading explained; this post is about the running total and what people read into it.
What the line can and can't say
The level carries almost no information. A CVD of −6,000 at 11:00 AM ET means that since the reset, 6,000 more contracts were sold into bids than bought from offers. It says nothing about who holds positions, because every one of those trades had a buyer and a seller, and the passive side, the limit order that was hit, never appears in delta. Start the count at a different time and the same minute reads −6,000 or +1,500.
What carries information is change between two points inside the same count. The slope is net aggression over time. A rising line with rising price means buyers are paying the offer and price is responding. A flat line during a quiet range means aggressive buying and selling roughly cancel; it doesn't mean nothing is trading. The interesting stretches are the ones where slope and price disagree.
One divergence, four explanations
A hypothetical NQ morning. At 10:05 AM ET (16:05 CEST) price prints 25,080 with CVD at +4,200 since the 9:30 open. Price pulls back, and at 10:40 it prints 25,092 while CVD has only reached +2,900. Higher high in price, lower high in delta.
Exhaustion. Fewer contracts were willing to pay the offer at the new high. The buying that drove the first push has thinned, and the move is closer to its end. This is the textbook reading and the one most indicators are built to flag.
Thin offers. Price can rise on less buying when the sellers above pulled their limit orders. A lower CVD high then shows a market that needed less aggression to move, which can come before continuation as easily as before a reversal.
Passive buyers. Look at the pullback between the two highs. If CVD fell 1,800 there while price gave up only a few points, aggressive sellers were hitting bids that kept refilling. The lower CVD high is that selling, absorbed, and the second high was made against it. That's a bullish picture wearing a bearish label.
Another market led. Index arbitrage ties NQ to the Nasdaq-100 stocks, and NQ rarely strays far from ES. When a move starts in the stocks or in ES, NQ can be pulled higher with relatively little buying of its own, and its CVD lags for reasons that have nothing to do with NQ buyers giving up.
The divergence alone can't separate these. What price does next can, and so can where it happened: at a level marked before the open the divergence is a candidate worth watching, in the middle of nowhere it's a coincidence. The footprint at the high, shown in volumetric bars, or the book on a heatmap adds the passive side that CVD leaves out. Absorption and exhaustion are hypotheses until price confirms one of them.
Settings that create or erase a divergence
| Setting | What it changes |
|---|---|
| Reset point | Within one count, nothing about the shape, only the level. It decides which highs can be compared: on a line that resets at 9:30 AM ET (15:30 CEST), the overnight high from 4:00 AM has no CVD value at all, while a line reset at the 6:00 PM ET (00:00 CEST) Globex open can show a divergence against it |
| Candles vs line, bar size | CVD drawn as candles has highs and lows that depend on how bars are cut; a divergence on candle highs can vanish on closes |
| Delta type | Bid/ask classification and up/down tick classification sort the same trades differently, and small divergences can exist on one and not the other |
| Size filter | A filtered CVD follows larger orders only; a divergence on the full line can be missing on the filtered one, and the reverse |
| NQ vs MNQ | Different participants, different totals; MNQ's CVD is its own market, not a scaled copy of NQ's |
In NinjaTrader the delta type, the size filter and the Session or Bar period are settings of one indicator, while the reset time comes from the chart's trading hours, and cumulative delta in NinjaTrader 8 goes through which setting produces which difference. The practical rule is to pick one reset, one delta type and one filter, and to compare only highs and lows that sit inside the same count.
Traders who use CVD tend to use it in one of three roles. As a veto: price reaches a level to fade, CVD is still climbing steeply, and the fade waits. As trend confirmation: slope and price agree, and a pullback with flat CVD is treated as a pause. As a divergence watch at levels only, with an entry that needs price to break the last swing first. The veto costs the fewest trades; the divergence watch produces the most signals and the most false ones.
My own chart has no CVD on it. I trade the European morning, when a line reset at the US open wouldn't exist yet, and the order flow I look at is Bookmap at levels marked before the session.
Educational content, not investment advice. Futures trading involves substantial risk of loss. Examples are for illustration only. Read the full Risk Disclosure.