Gamma Levels for NQ: Call Wall, Put Wall and the Flip as Key Levels
The regime is one number; the walls and the flip are prices, and prices can go on the chart. Where to get gamma levels for NQ every morning, how to convert QQQ and NDX strikes to futures, how to draw them in NinjaTrader 8 next to your other levels, and the mornings when the map breaks.
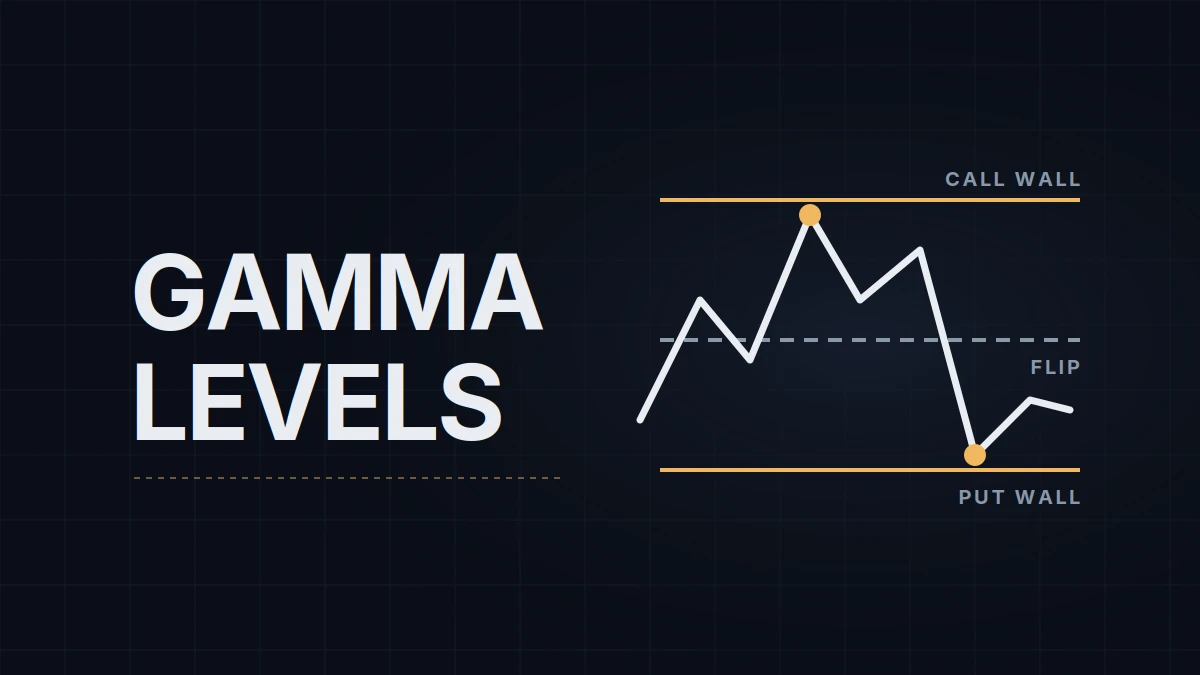
Most traders who open a gamma report read one number, the regime, and skip the rest. The walls and the flip are prices, and a price can go on the chart next to yesterday's high. This post is about doing that with gamma levels on NQ: where to get them every morning, how to convert them from index and ETF options to the E-mini Nasdaq-100 future, how to draw them in NinjaTrader 8 beside the levels you already mark, and what to do on the mornings when the numbers stop making sense. Why dealer hedging should slow price at a strike in the first place is covered in the positive vs negative gamma post; here the mechanism is taken as given.
Three prices out of one model
Every gamma report starts from the same arithmetic: open interest at each strike, times that option's gamma, times the contract size, with a sign attached by assumption about who holds what. Three prices fall out of it.
The call wall is the strike above price with the largest call gamma. If dealers are long those calls, they sell futures as price rises toward the strike, so a rally into it has to absorb extra selling. On quiet days it tends to cap the session.
The put wall is the strike below price with the largest put gamma. It behaves less neatly than its name suggests. Dealers who are short those puts have to sell futures as price falls toward the strike, which pushes price down into it; the bounce people describe usually comes after the test, when that hedging is unwound. Read it as a place where the market makes a decision.
The gamma flip, also called zero gamma, is the price where the model's net dealer gamma changes sign. It is an interpolated line rather than a strike, each vendor interpolates differently, and it is the level that moves most from one source to the next.
Vendors add more on top: a high-volatility level, max pain, separate 0DTE walls (walls built only from options that expire today). They come from the same open interest. Three levels are easier to trade than eight.
Where to get them
| Source | Cost at the time of writing | Options used | How it arrives |
|---|---|---|---|
| ZeroGEX | free page, delayed about 15 minutes; live data paid | NDX and QQQ, with NQ-converted levels listed | web page |
| QuantWheel | free, 3 calculations a day; more on a paid plan | QQQ, expirations you choose | web chart and heatmap |
| GEX Metrix | free, delayed 15 minutes | QQQ, through the current monthly expiration | web page, formula published |
| MenthorQ | paid subscription | QQQ, NDX and futures options | NinjaTrader 8 indicator over an API, TradingView |
SpotGamma, Tier1 Alpha and Volland sell similar reports. The free pages are enough to learn the routine; the paid ones mostly save the typing and add intraday updates.
Three questions explain why two sources disagree on the same morning. Which options go in: NDX index options, QQQ options, options on NQ futures, or a mix. Which expirations: today only, everything through the monthly, or the whole chain. And when the snapshot was taken: last night's open interest, or an intraday estimate built on top of it. Answer those differently and you get different walls, with neither vendor making an error. Pick one source as primary and use a second only as a cross-check.
Converting strikes to NQ
QQQ and NDX don't trade at NQ prices, so every level needs converting unless the vendor has done it for you.
NDX to NQ uses a spread, because both are quoted in index points. NDX is a cash index and stops at 4:00 PM ET (22:00 CEST), so the pre-market spread comes from yesterday's close: NQ at 4:00 PM ET minus the NDX closing value. With NQ at 29,050 and NDX at 28,760, the spread is +290, and an NDX call wall at 29,000 goes on the NQ chart at 29,290. The spread is the futures premium over cash. It shrinks toward zero into expiration and jumps when the market rolls to the next quarter, so it gets recalculated every morning.
QQQ to NQ uses a ratio, because QQQ is an ETF priced at roughly 1/41 of the index. With NQ at 29,050 and QQQ at 700.00 at the same moment, the ratio is 41.5, and a QQQ call wall at 710 maps to 29,465. QQQ strikes near the money are $1 apart, which is about 41 NQ points between strikes. A converted QQQ wall is a zone about 20 points either side of the line.
Take both prices at the same timestamp. A QQQ close paired with an NQ price from 3:00 AM ET carries the whole overnight move into the error. Pages that already list NQ-converted levels are fine to use; check once which method they apply.
Drawing them in NinjaTrader 8
A horizontal line per level, with four decisions made once:
- A separate style. Gamma levels get their own line style, dashed for example, while PDH/PDL, the overnight range and the value area stay solid. When price stalls, you can see which kind of level it stalled at.
- Attached to the instrument, not the chart. Set the line to attach to the instrument so it appears on the range chart and the 15-minute chart at once; the drawing tools post walks through the setting.
- A label with source and date, such as CW 29,465 Q 9/24. The most common mistake with gamma levels is a Monday call wall still on the chart on Thursday.
- A zone where the source is coarse. QQQ-derived levels go on as a rectangle 20 points either side; NDX-derived ones can stay as lines.
The paid NT8 integrations draw all of this automatically and refresh it; the manual routine takes about three minutes a morning.
How traders use them
There are three common approaches, and they conflict.
Some trade the walls as standalone levels: a rejection at the call wall is a short, a hold at the put wall is a long, whether or not anything else sits there. This gives the most setups and the most false ones, because a wall is a concentration of hedging, not an order anyone has to defend.
Some use them only as confirmation. A call wall within about 10 points of the overnight high or the value area high turns one level into a level with two reasons; a wall in empty space gets drawn and then ignored. Fewer trades, and the walls never originate an idea.
Some use them only for exits: the next wall in the direction of the trade is where part of the position comes off, because that is where a move is most likely to slow. This leaves entries to the rest of the method and costs the occasional run that goes straight through.
The mornings the map breaks
A gap beyond a wall. If NQ opens above yesterday's call wall, that wall was computed from positions that have since been hedged and adjusted. Drop it and look at the next strike up, or wait for the intraday update.
Monthly expiration. On the third Friday the largest positions leave the book at once. The next ones are October 16, November 20 and December 18, 2026; the December date is also the expiration of the December NQ contract. Walls built mostly on the monthly can vanish over the weekend, and Monday's list may look nothing like Friday's.
Vendors that disagree. Two sources within about 15 NQ points of each other describe one zone. Two sources 80 points apart describe no level. The flip is the worst offender.
Data mornings. On a CPI day the morning snapshot is rewritten by same-day options within the first hour; on an FOMC day the same happens after the 2:00 PM ET statement. The calendar says which days those are.
The regime call comes first in my notes. The walls go on the chart dashed, and they only get traded when one lands near a level that was already there.
Educational content, not investment advice. Futures trading involves substantial risk of loss. Examples are for illustration only. Read the full Risk Disclosure.