Drawing Tools and Alerts in NinjaTrader 8: Levels That Persist Across Charts and Sessions
Draw PDH on the 15-minute chart and it isn't on the range chart. One setting fixes that, one window fixes every line at once, one dialog hangs a sound on the level. What Attach to does, which four tools mark levels, how to build an alert that fires more than once, and why nothing fires at night.
A drawing in NinjaTrader 8 belongs to the chart it was drawn on. Draw yesterday's high on a 15-minute chart, switch to the range chart you execute from, and the line isn't there; close the tab without saving the workspace and it's gone. Both problems have a setting behind them, and so does the third one, which is that a line does nothing at 3:00 AM unless something is watching it. This post covers the two ways NinjaTrader stores a drawing, how to make a level show on every chart of the instrument, the four drawing tools that do the level work, and how to hang an alert on a line. It assumes the chart setup and takes its list of levels from the key levels post.
Two places a drawing can live
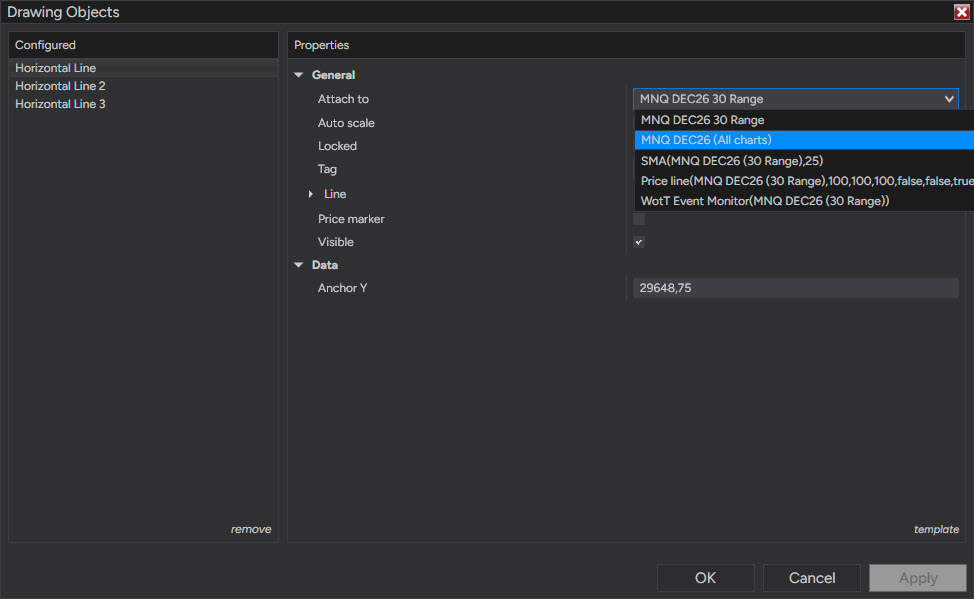
Every drawing object has a property called Attach to, with two values that matter here: the chart's own data series, shown as the contract and bar type (MNQ DEC26 30 Range in the screenshot below), or the contract with (All charts) after it. The same list also offers each indicator on the chart, for drawings that belong to an indicator's scale. The first is the default, and it's what makes drawings vanish.
| Attached to this chart | All charts (global) | |
|---|---|---|
| Visible on | this chart tab only | every chart of MNQ 12-26, open now or opened later |
| Saved in | the workspace file, with the chart | NinjaTrader itself, outside the workspace file |
| Survives closing the tab | no | yes, even with no chart of the instrument open |
| Survives a restart | if the workspace was saved | yes |
| Moving or deleting it | changes this chart | changes it on every chart at once |
| Shows on MNQ 03-27 after the roll | no | no |
The last row matters every three months. A global object is attached to a contract, not to a symbol, so levels drawn on the September contract don't appear on December. That is the right behavior: the two contracts trade at different prices, and yesterday's high on one is not yesterday's high on the other.
Making a level global
- Draw the level, then double-click it (or right-click it and choose Properties). The Drawing Objects window opens with that object selected.
- Under General, change Attach to from MNQ 12-26 to MNQ 12-26 (All charts) and click OK.
- There is no way to make that the default. A drawing template (Template at the bottom right of the window) saves color, width, dash style and auto scale, and Attach to always comes back as the chart's own series. Each level is switched to All charts by hand, or in bulk: open the Drawing Objects window from any chart (right-click › Drawing Tools › Drawing Objects), which lists every object on the chart, select the ones to convert in the list on the left and change Attach to once.
- On each chart that should show the levels, right-click, open Data Series, and confirm Show global draw objects is checked. It is checked by default; uncheck it on a chart you want clean.
- If you work in more than one workspace, go to the Control Center, Tools › Settings › General (the window is called Options in older builds), and enable Global drawing objects across workspaces. Without it, "all charts" means all charts in the current workspace.
Three consequences follow. A global object is one object, so dragging it a tick on the 15-minute chart drags it on the range chart, and deleting it anywhere deletes it everywhere. A global object only shows on charts whose data series uses the same scale justification as the one it was drawn on, so a series moved to the left scale stops showing the right-scale levels. And because global objects are not in the workspace file, a copy of the workspace does not back them up; a NinjaTrader backup does.
The tools that do the level work
NinjaTrader ships around thirty drawing tools. Four of them do nearly all the work of marking levels.
| Tool | For | Detail worth knowing |
|---|---|---|
| Horizontal line (F6) | A level that is a price: PDH, PDL, POC, VAH, VAL | Anchored to price only, so it spans every bar; the price prints on the axis |
| Ray (F3) | A level that began at a moment: the overnight high set at 4:12 AM ET / 10:12 CEST | Anchored to a bar and extended right; on a tick or range chart the anchor stays on the same trade |
| Rectangle (Ctrl+F12) | A zone: the value area, a two-tick band around a level | Snap both corners to price; set the fill opacity low or the candles disappear behind it |
| Ruler (Ctrl+F3) | A stop distance, a range, the time between two points | Three clicks: two anchors and a third for the flag; reports bars, elapsed time and price distance, and it stays on the chart until you remove it |
Three toolbar habits save more time than any tool. Snap mode (in the Drawing Tools menu) has five settings: Disabled, Bar, Tick, Bar and Tick, and Bar and Object; for levels, Tick puts the line on the tick you meant rather than a pixel off it. Lock (right-click the object) stops a dragged chart from dragging the level with it, which happens more than you'd expect on a trackpad, and a locked object also survives Remove All Drawing Objects. And the Drawing Objects window is the only place that lists everything on the chart, including objects scrolled out of view, which is where last month's lines hide when a chart starts feeling slow.
Putting an alert on a level
An alert in NinjaTrader is a condition attached to a chart tab plus an action. Click the line to select it and choose Alert (or right-click the chart, choose Alerts, and pick the object inside the condition), and the Alerts dialog opens with a Condition Builder for the condition and the actions below.
| Setting | For a level alert | Why |
|---|---|---|
| Condition, left side | Data series › price type Close, bars ago 0 | The close of bar 0 is the last traded price; an offset of a few ticks here makes the alert arrive before the touch, because offsets cannot be applied to the drawing object itself |
| Operator | Cross above (or Cross below) | "Greater than" fires on every tick above the level, not on the touch |
| Condition, right side | Drawing object › your line | Any drawing object on the chart is offered here once it exists |
| Action | Play sound, and a pop-up dialog or a message to the Alerts Log | Email and messaging go through a Share service that has to be configured first |
| Rearm type | On condition reversed, or On bar close | A new alert starts on Never, which fires once and stays dead until you rearm it by hand; On timer repeats every set number of seconds |
| Enabled | checked | The alert saves fine unchecked and never fires |
A small bell appears in the chart's top-left corner while an alert is active, and triggered alerts land in the Alerts Log (Control Center › New › Alerts Log) with the time and the message. The dialog also offers an order action, which submits an order when the condition fires; that is automation and belongs with ATM strategies rather than with a sound.
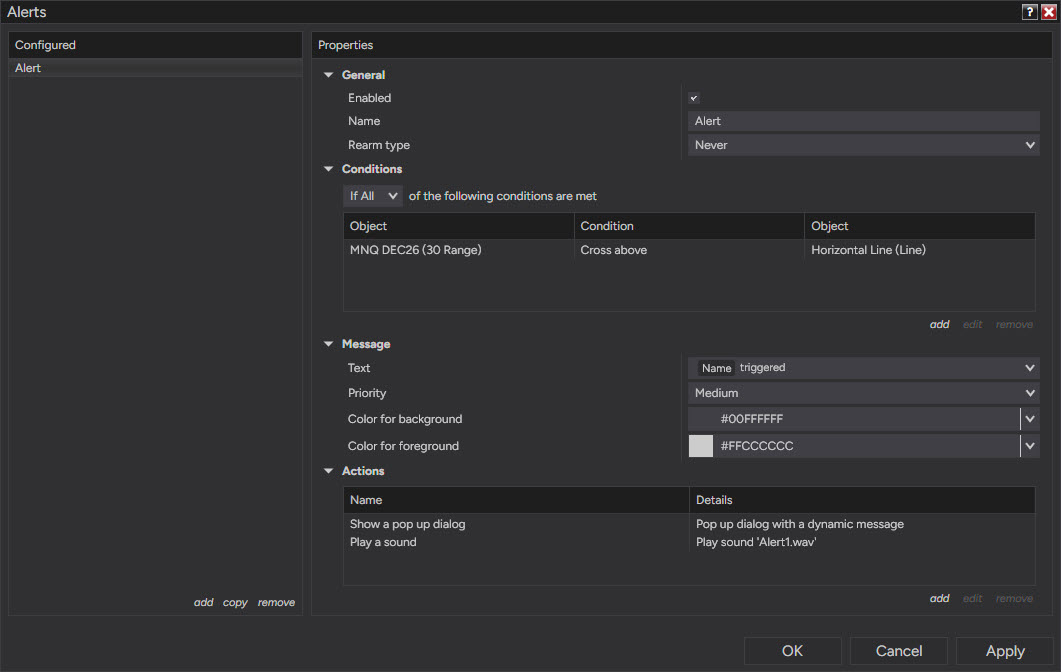
Rearm deserves its own paragraph. With Never, an alert on PDH fires the first time price crosses it and is silent for the rest of the session. With On condition reversed, it rearms as soon as price is back on the other side of the level, so a level that is tested three times sounds three times. With On bar close, it can fire again after the bar in which it triggered has closed and the condition has become true again; with On timer, after a set number of seconds, which is how traders get an alert to repeat while price sits on a level. There is also Remove, which fires once and deletes the alert, and On connect, which rearms after a manual reconnect.
The limits are worth more than the features. An alert is local to the chart tab: it runs while that tab is open, in a running NinjaTrader, connected to data, and not otherwise. Close the tab and the alert goes with it; close NinjaTrader for the night and nothing watches the level until you open it again; a laptop that goes to sleep is a laptop with no alerts. There is no server-side alert in NinjaTrader 8. The Share services can push an alert to email or a messaging app, but only from a platform that is running, so anything that must fire while your computer is off has to live somewhere else. The second limit is Playback: alerts are checked every 200 milliseconds, and the help guide says plainly that they are not meant for Market Replay at raised speed, where a crossing can slip through unnoticed. Test the alert at 1×, and keep replay in its own workspace.
Lines by hand or lines by indicator
Every level in the key levels list can be computed, and an indicator that draws PDH, PDL and the overnight range each morning never goes stale, never needs redrawing after the roll, and never sits on the wrong contract. What it can't do is judgment: it draws yesterday's high on a holiday half-session with the same confidence as on a normal day, and it doesn't know that today's POC sits two ticks from PDL and the two are one level. Indicator plots also work in alert conditions (Indicator on the right side of the Condition Builder instead of Drawing object), so the alert side is the same either way.
I draw the levels by hand from a time chart before the session and switch them to All charts as I go, so the range chart I execute from carries them without a second pass. Alerts I use for one thing: a level on the far side of the range that I don't expect to trade for hours, so I can leave the screen without leaving the level.