In 127 New York sessions on NQ, the first hour's range broke on one side only 79.5% of the time, on both sides 15.8%, and not at all 4.7%. Those figures come from an edgeful blog post published on February 19, 2026, quoting its IB report for the six months before it. The first hour here is the initial balance (IB): the high and low from 9:30 to 10:30 AM ET (15:30 to 16:30 CET), introduced in the opening range and initial balance post.
On NQ an IB is often 100 points or more. A 120-point IB is $2,400 on one NQ contract and $240 on one MNQ, using the values in the NQ vs MNQ tick and point value guide, so how far price travels past it is real money either way.
Break, extension and the three kinds of day
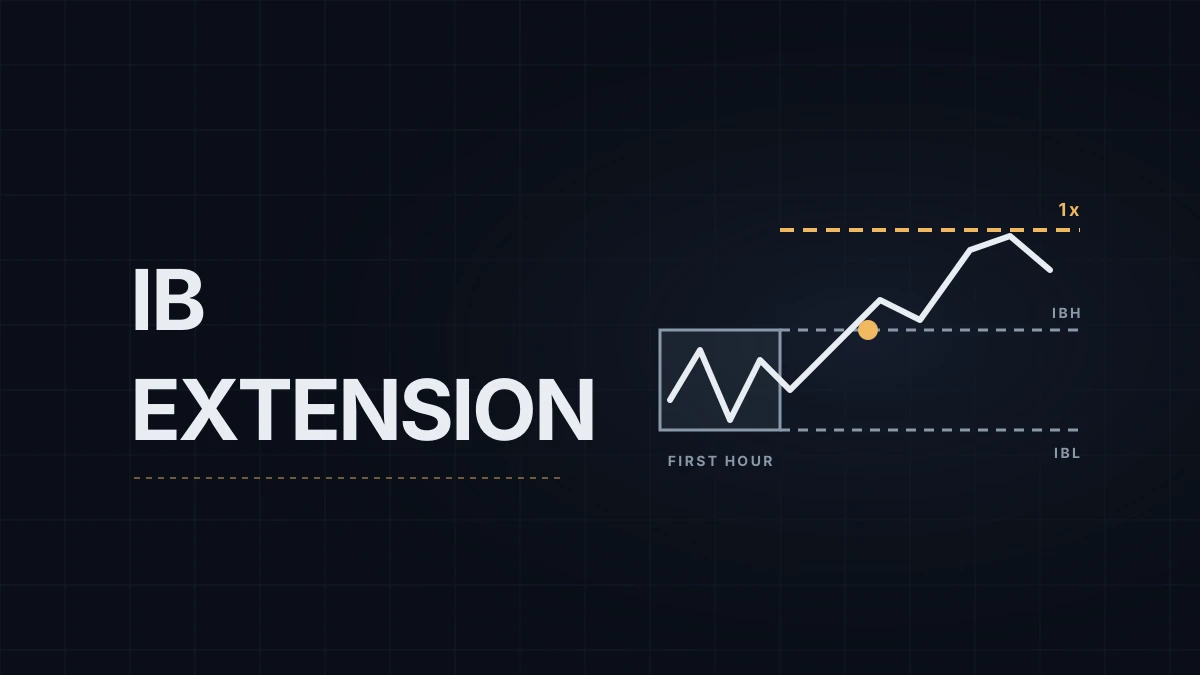
A break is the first trade beyond the IB high (IBH) or IB low (IBL) after 10:30. The extension is how far price goes past the broken edge, usually measured in multiples of the IB range: on a 120-point IB, a 1x extension above IBH is 120 points above it. A day is a single break when only one side goes, a double break when both do, and a no break day when the first hour holds the whole session.
| Day type (edgeful, 127 sessions to February 2026) | Sessions | Share |
|---|---|---|
| Single break | 101 | 79.5% |
| Double break | 20 | 15.8% |
| No break | 6 | 4.7% |
What a longer sample adds
A TradingView script called NQ IB Odds, published in October 2026, ships with statistics computed from 1,814 sessions of 1-minute NQ data, June 2019 to October 2026, from one data vendor the author doesn't name. It splits sessions by where the IB closed at 10:30 relative to its midpoint:
| IB closed at 10:30 | IBH broke first | IBL broke first | No break |
|---|---|---|---|
| In the upper half | 77% | 20% | 3% |
| In the lower half | 21% | 74% | 5% |
It also sorts IBs by size, comparing the first hour's range with the average range from 10:30 to 16:00 over the previous 20 sessions. Small IBs almost never hold the day (1% no-break) and break both sides in 31% to 33% of sessions. Large IBs hold the day in 5% to 9% of sessions and break both sides in 12% to 13%. In the upper-half case, price reached a full 1x extension above IBH in 27% of small-IB sessions and 9% of large ones. Two more notes from the same source: down breaks extended further than up breaks in every size class, and since February 2025 extensions ran about 10% to 15% smaller than over the full history.
What these numbers can and can't tell you
A break happens on roughly 95% of days, so "the IB will break" isn't information on its own. What carries information is the side, the distance and the context: where the first hour closed and how big it was compared with recent days. A small IB says the market hasn't spent its range yet; a large one says the first hour already did much of the day's work. The session open types post describes how the open itself often sets that up.
Sample size matters even at 127 sessions. An 80% rate measured on 127 days has a 95% confidence interval of about 73% to 87%, a seven-point margin either way; the trading sample size post shows where that comes from. Definitions matter too. The TradingView script counts the first trade beyond the edge, while edgeful lets its users count a wick or a bar close and doesn't say which setting produced these figures. The period matters as well: the TradingStats study quoted in the opening range post, 2,833 NQ sessions from 2015 to 2025, has both sides breaking on 22.6% of days, against 15.8% in edgeful's six months. edgeful is a paid product and the TradingView script is free to use but closed-source; neither publishes its raw data.
Building your own count
You need one row per session and about 100 sessions before the shares settle down:
- On a 1-minute NQ chart with a regular-hours template, mark IBH and IBL at 10:30 AM ET and note whether the 10:30 price sits in the upper or lower half.
- Record which side breaks first and at what time, and whether the other side breaks later.
- At 4:00 PM ET, record the furthest extension beyond each broken edge, divided by the IB range.
- Add the IB range divided by the average 10:30 to 4:00 PM range of the previous 20 sessions, so you can split small and large IBs.
A spreadsheet with those seven or eight columns answers the questions above for the period you trade, which may not be 2019 to 2026. It's also the honest test of whether a first-hour breakout plan has an edge after your entry and exit rules, or only on paper.
Educational content, not investment advice. Futures trading involves substantial risk of loss. Examples are for illustration only. Read the full Risk Disclosure.