How Many Trades Before You Judge a Setup? Sample Size for Traders
What 20, 50, 100 and 300 trades can and can't tell you about a setup, with the ranges computed: how often a real edge shows a losing record, how often no edge looks good, a rule of thumb for the count you need, why trailing exits need more, and what to do while the sample is small.
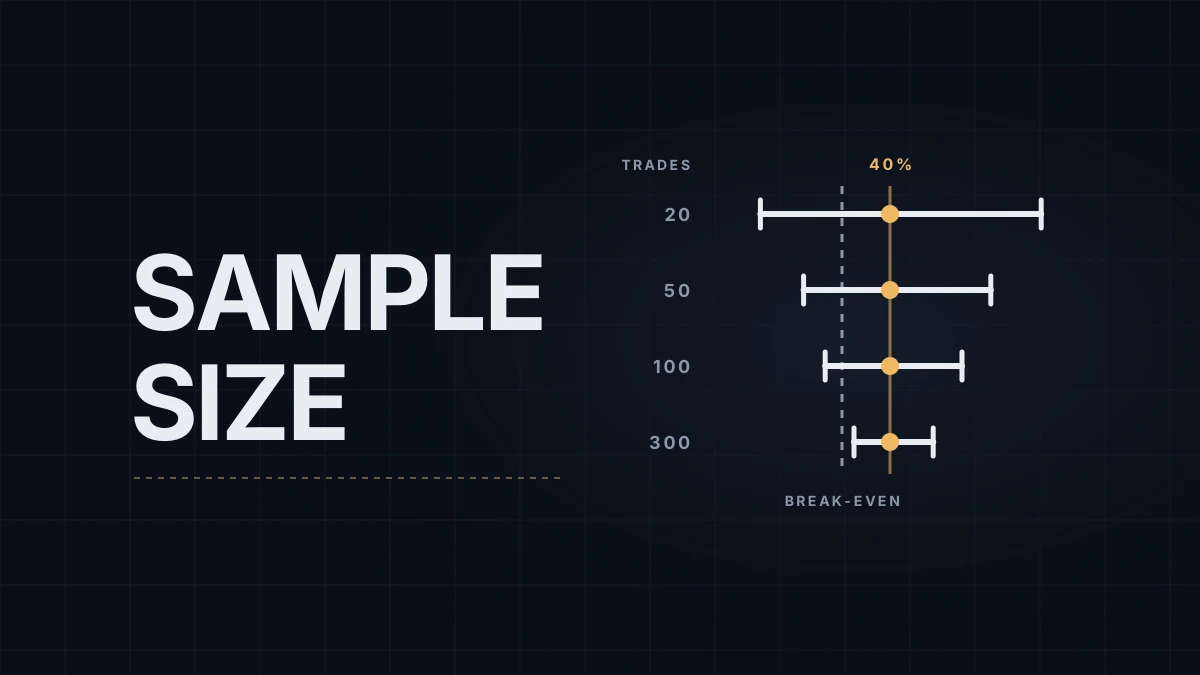
How many trades to test a strategy before its numbers mean something? If the log shows a 40% win rate, with winners twice the size of the losers, about 200. After 20 trades, the same log can't tell a setup that makes 0.84R per trade from one that loses about a third of an R per trade.
R is the amount a trade risks: the distance from entry to stop, times the point value, times the number of contracts. A 2R winner made twice what it risked. A sample also needs a setup defined tightly enough that two traders marking the same price chart would log the same trades. If the definition drifts, every trade belongs to a slightly different setup, and no count is ever big enough.
The expectancy post puts the standard error of a win rate measured over 50 trades at about seven percentage points; a 95% range runs about two of those either way. Below, the same question runs at four sample sizes and ends in a rule you can apply to your own log.
What 20, 50, 100 and 300 trades can tell you
Take a hypothetical setup with a real win rate of 40%, a 2R gain on each winner and a 1R loss on each loser. Its expectancy, the average result per trade, is 0.4 × 2 − 0.6 × 1 = +0.2R. Its break-even win rate is one in three: below 33.3% wins, the 2:1 payoff no longer covers the losses.
Now say a trader logs this setup and measures exactly 40% at each sample size. The middle columns give the range where the true numbers plausibly sit, given that log (a 95% Wilson interval, a standard way to put bounds on a measured rate). The last two show how often luck alone points the wrong way at that size.
| Trades (wins) | True win rate, 95% range | Expectancy, 95% range | Real +0.2R setup shows a loss | No-edge setup shows 40% or more |
|---|---|---|---|---|
| 20 (8) | 22% to 61% | −0.34R to +0.84R | 25% of samples | 34% of samples |
| 50 (20) | 28% to 54% | −0.17R to +0.61R | 16% | 20% |
| 100 (40) | 31% to 50% | −0.07R to +0.49R | 9% | 10% |
| 300 (120) | 35% to 46% | +0.04R to +0.37R | under 1% | 1% |
At 20 trades luck misleads often, and in both directions. A setup that earns +0.2R shows a losing record in a quarter of 20-trade samples, and a setup with no edge at all, a true win rate of 33.3%, shows 40% or better in a third of them. A trader who drops setups after a bad 20 and keeps them after a good 20 is mostly sorting noise.
The ranges shrink with the square root of the sample, so four times the trades only halves the range: about ±13 points of win rate at 50 trades, under ±7 at 200 and ±5.5 at 300. Only the 300-trade row keeps the whole expectancy range above zero. Solved directly, a measured 40% at 2:1 clears the 33.3% break-even at about 200 trades.
That puts the staged testing in the backtest vs live post, 30 to 50 trades per stage, in perspective. A stage that size can catch a broken rule; confirming a working one takes a count closer to the table's last row.
A rule of thumb for your own setup
The count needed to separate a win rate from its break-even comes out of one line: n ≈ 4 × p × (1 − p) ÷ (p − b)², where p is the win rate and b the break-even win rate. The 4 is two standard errors, squared. For 40% against 33.3%, that's 4 × 0.4 × 0.6 ÷ 0.0667², about 216.
Thinner edges need far more. A 1:1 setup that wins 55% against its 50% break-even needs 4 × 0.55 × 0.45 ÷ 0.05², about 396 trades. Pinning a win rate near 50% to within ±10 points takes about 100 trades, and within ±5 points about 400, four times as many.
The 216 and the 396 are the counts at which a log that comes in at exactly p just clears b. A setup whose true win rate is p produces a log that good only about half the time: at 200 trades, 53% of logs from a real 40% setup clear the 2:1 break-even. For a four-in-five chance of seeing the edge, double the count; at 400 trades it's 81%.
Trailing exits need more
Fixed 2R targets are the easy case. A trailing exit pays winners of different sizes, and that widens the spread of results per trade. Give the same setup winners that still average 2R but vary with a standard deviation of 1.75R, and the spread per trade rises from 1.47R to 1.84R. Every expectancy range in the table widens by about a quarter, and by about a third at 20 trades. At 300 trades the range now reaches just below zero, −0.01R to +0.41R, and in 40,000 simulated samples, 14% of 100-trade logs showed a loss, against 9% with fixed winners.
Why the real count is smaller than the log
Trades come in clusters. Fifty trades taken in one trending fortnight say more about trending fortnights than about the setup. Spreading the sample across trend and range conditions is worth more than adding trades from the same week.
Filters split the sample. Cut 100 trades into four conditions and you have four samples of 25, and the table's first row says roughly what 25 trades are worth. Every filter tested on the same log is also one more chance to find a pattern that isn't there.
Stopping on a good streak. Checking a running total after every trade and stopping at the first good-looking moment makes a no-edge setup look good far more often than the last column suggests. Fix the number of trades before the first one.
The trader changes too. The first 50 trades of a new setup mix its edge with the trader's learning curve, so the early numbers describe both.
While the sample is small
Four habits help, and they work together:
- Grow the count without money at risk. Market Replay plays recorded sessions back faster than real time, and logging every signal the setup produces, taken or skipped, adds data without adding trades.
- Trade the smallest size. One MNQ (Micro E-mini Nasdaq-100, $2 a point) keeps a 200-trade learning period cheap. Size goes up when the sample says so, not after a good week.
- Grade the process. Until the count means something, judge each trade by whether it followed the rules; trade setup grading is one way to score it.
- Write the decision down first, for example: at 100 trades, drop the setup if the whole expectancy range sits below zero; at 200, add size if the whole range sits above it.
My own gate before a setup goes onto an evaluation is 40 trades on replay and 40 on a sim account. The table says what those 80 buy: enough to catch a broken rule, not enough to prove an edge. For a setup I'm automating, a logger records every signal on historical data, which gets the count into the hundreds before any money depends on it.
Educational content, not investment advice. Futures trading involves substantial risk of loss. Examples are for illustration only. Read the full Risk Disclosure.