Fair Value and Basis: Why NQ Trades Above the Nasdaq-100 Cash Index
Put NQ next to the Nasdaq-100 and the future sits about 100 points higher. That gap is the basis: interest on money you didn't spend, minus dividends you don't get. The fair value formula, a worked example for December and March, and how to move QQQ and NDX levels onto an NQ chart.
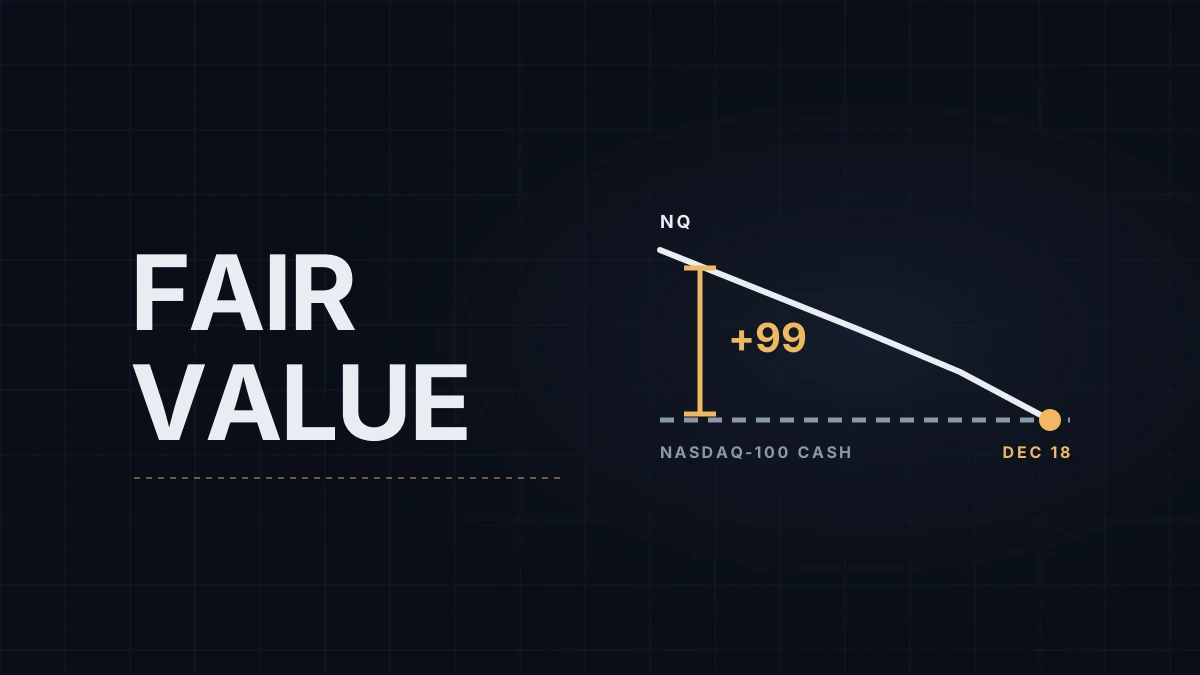
"Why is NQ 100 points above the Nasdaq-100?" is one of the first things people search after putting the future and the cash index on the same screen. The gap is called the basis, and most of it is arithmetic. A futures buyer gets exposure to the E-mini Nasdaq-100 without paying for the stocks, so the price adds the interest that cash would have earned and subtracts the dividends the stocks pay before expiration. The price that balances those two is the NQ fair value. If tick and point values are still new, the futures pillar covers them first.
The formula
Fair value = cash index × (1 + (r − d) × days ÷ 365)
Here r is the short-term interest rate, d is the index's dividend yield until expiration, and days is the number of calendar days left until the contract expires. The basis is simply the future minus the cash index, and at fair value it equals the carry: index × (r − d) × days ÷ 365.
CME uses the same idea when it has to derive an equity index settlement price from the cash index: index price plus days to expiration over 365, times an interest rate, times the index price, where the interest rate component already has expected dividends subtracted.
A worked example
The inputs below are rounded so the arithmetic is easy to follow. After the October 28, 2026 meeting the Fed's target range is 3.75% to 4.00% (at the time of writing), so take a financing rate of 3.9%. The Nasdaq-100 pays little in dividends; take 0.6% a year. That leaves a net carry of 3.3%. The cash index is set at 28,000 because it's a round number, not because it's a forecast.
| December 2026 (NQZ6) | March 2027 (NQH7) | |
|---|---|---|
| Expiration | Friday, December 18, 2026 | Friday, March 19, 2027 |
| Days from Monday, November 9 | 39 | 130 |
| Carry: 28,000 × 3.3% × days ÷ 365 | about 99 points | about 329 points |
| Fair value | about 28,099 | about 28,329 |
The basis shrinks every day. At these inputs it loses about 2.5 points a day (28,000 × 3.3% ÷ 365). On expiration morning it reaches zero, because the December contract settles to a special opening quotation of the index itself, covered in cash settlement and the week before December 18.
Dividends are the small term. Over those 39 days interest is worth about 117 points and dividends about 18. For an index full of companies that pay little or nothing, the rate does most of the work, so NQ's basis widens when short rates rise and narrows when they fall.
The roll moves your chart. March carries about 230 more points of basis than December. When volume moves to March on Monday, December 14, CME's roll date, a continuous NQ chart that switches contracts without back-adjustment jumps by roughly that amount, and a level drawn on December prices sits about 230 points too low on the March chart. Rollover and contract months covers the switch itself.
"Above fair value" in the morning
Pre-market reports often say futures are trading above or below fair value. That compares the live future with the fair value calculated from yesterday's cash close. With December NQ at 28,150 and a fair value of 28,099 over a 28,000 close, futures sit about 51 points above fair value, which implies a cash open roughly 51 points (0.18%) higher if nothing changes before 9:30 AM ET (15:30 CET). The raw 150-point gap between the future and yesterday's close would overstate the expected open by the 99 points of carry.
The basis doesn't sit exactly on fair value. Arbitrage between the future and the underlying stocks keeps it close, and how close depends on financing costs that differ from one firm to another. That's also why two data sources can quote fair value a few points apart.
Converting levels from NDX and QQQ to NQ
Levels published on the cash index or on QQQ need two steps before they belong on an NQ chart. Gamma levels are a common case, see gamma levels on NQ.
- QQQ to NDX. Multiply by the ratio of the Nasdaq-100 (NDX) to QQQ at the same moment. It was close to 41 in October 2026 (NQ vs QQQ vs NDX has the details), but it drifts, so divide the two live prices instead of trusting a fixed number.
- NDX to NQ. Add the current basis, measured as NQ minus NDX during cash hours, or the fair value carry when the stock market is closed.
A QQQ level at $690 is about 28,359 on NDX (690 × 41.1, the ratio in late October) and about 28,458 on December NQ with a 99-point basis. Skip the second step and the level lands 99 points away from where the flow tied to it would show up. On MNQ that is $198 per contract, more than many intraday stops.
Educational content, not investment advice. Futures trading involves substantial risk of loss. Examples are for illustration only. Read the full Risk Disclosure.