Time and Sales on NQ: Reading the Tape When the Heatmap Is Too Much
The time and sales window lists every NQ trade with its price, size and side. What the colors mean, why the same order prints differently on different data connections, the size and aggregation filters in NinjaTrader 8, and the moments when the tape says more than a candle.
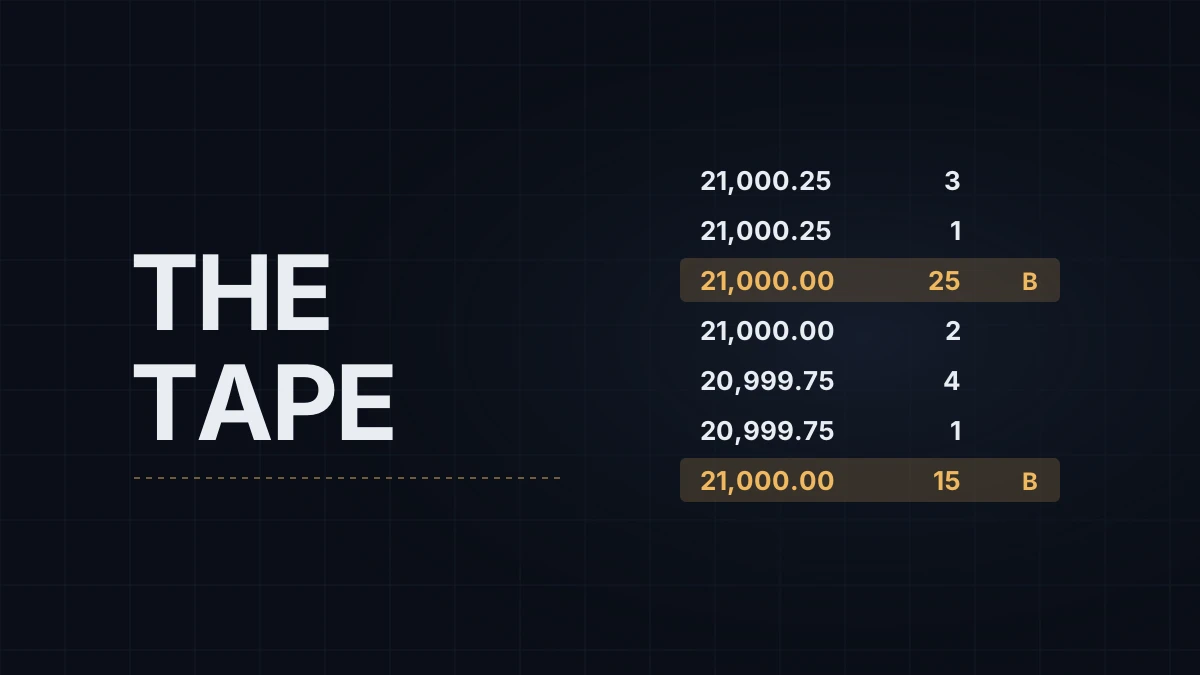
A trader sends a 40-lot market buy in E-mini Nasdaq-100 futures (NQ). It fills 25 contracts at 21,000.00 and 15 at 21,000.25, against nine different resting sell orders. On one data connection that trade appears in the time and sales window as two prints, 25 and 15. On another it can appear as nine smaller ones. Same trade, same exchange, a different-looking tape, and everything you read from the tape depends on which version you're looking at. Time and sales, also called the tape, is the running list of every trade: time, price, size, and whether it hit the bid or lifted the offer. Contract basics are in the NQ and MNQ tick value guide.
What each print says
Each line is colored by where the trade happened relative to the best bid and offer at that moment. In NinjaTrader 8 (New › T & S) the categories are:
| Category | What happened |
|---|---|
| At ask | A buyer used a market order and took the offer |
| At bid | A seller used a market order and hit the bid |
| Between | The trade printed inside the spread, rare in NQ where the spread is usually one tick |
| Above ask | The trade printed above the offer that was showing, usually because the book moved faster than the quote update |
| Below bid | The same on the sell side |
An at-ask print tells you who was in a hurry, not who will win. Every trade has a buyer and a seller; the tape only shows which one crossed the spread to get filled. The colors themselves are a setting, so match them to whatever you use elsewhere and leave red and green out of it if they already mean profit and loss on your screen.
One order, several prints
CME's trade message is a summary. Under its market data protocol (MDP 3.0), all the fills from one aggressive order are reported together in a single event, consolidated by price, with the aggressor's side marked and the individual order fills attached as detail; each data vendor decides which of the two to show. In the example that's one event with two price levels: 25 at 21,000.00 and 15 at 21,000.25.
NinjaTrader said in 2016 that its CQG-based connection of the time, Continuum, passed CME's summary through as sent, which is the two-print version; its staff have described the CQG feed both ways since. In the same post its product team described Rithmic as unbundling those events into the individual fills behind them, which would show up to nine smaller prints, and added, citing second-hand knowledge, that Rithmic's aggregation setting may not change this. Compare tapes only with traders on the same data connection.
This matters beyond the tape window. A tick chart counts trades, so a 500-tick bar closes at different points on an aggregated and an unaggregated feed, and a filter that hides prints under 10 contracts hides different trades on each. My context chart is a tick chart, which is why I keep the data connection the same on every machine. Rithmic vs Tradovate for prop accounts covers which firms use which feed, and chart timeframes and bar types explains tick bars.
Settings that keep it readable
NQ's tape moves too fast to read line by line during the US open, so the NinjaTrader 8 window gives you three ways to thin it out and one to add context:
- Size filter hides every trade below a minimum size. Setting it to 2 or 3 removes the single-lot prints.
- Block alert trade size marks larger trades with a "B" in the Block column, its own color and optionally a sound. Raise it until it fires a few times an hour, not every few seconds; a threshold that fires constantly is noise.
- Aggregation (seconds) is NinjaTrader's own bundling, separate from CME's: trades at the same price and the same side within that many seconds are merged into one line, stamped with the first trade's time. Zero means no bundling.
- Price - ask and Price - bid add the changing best bid and offer to the list, so you can see the quote move between prints; Show quotes adds a separate panel of quote fields you pick.
When the tape says more than the candle
A one-minute candle tells you where price went and how much traded. It doesn't tell you how. At a level you've marked in advance, the tape does. A run of at-bid prints into a support level while price refuses to tick lower says sellers are hitting a buyer who keeps absorbing them; that's the same picture as an iceberg refilling on a heatmap, described in iceberg orders on CME. A burst of prints across several prices inside a second is a sweep, often stops going off, covered in liquidity sweeps and stop runs. And prints drying up as price approaches a level says nobody is in a hurry there, which a candle can't show until the bar closes.
The tape is also the raw input behind the summaries most traders watch. Cumulative delta adds at-ask volume and subtracts at-bid volume, so a size filter on a delta indicator changes it, as CVD on NQ explains, and the same filter removes different prints on an aggregated and an unaggregated feed; volumetric bars in NinjaTrader sort the same prints into each bar by price. When a heatmap is too much information, reading the tape only at your levels, for the minute before and after price arrives, gives you most of what the heatmap would have said.
Educational content, not investment advice. Futures trading involves substantial risk of loss. Examples are for illustration only. Read the full Risk Disclosure.