Overnight Session on NQ: How Globex Sets Up the RTH Day
The overnight session trades a fraction of the day's volume and still draws the lines the cash session tests first. What RTH does with the overnight high and low, why the open's place in the range hints at which side breaks first, and what the width of the night does and doesn't tell you.
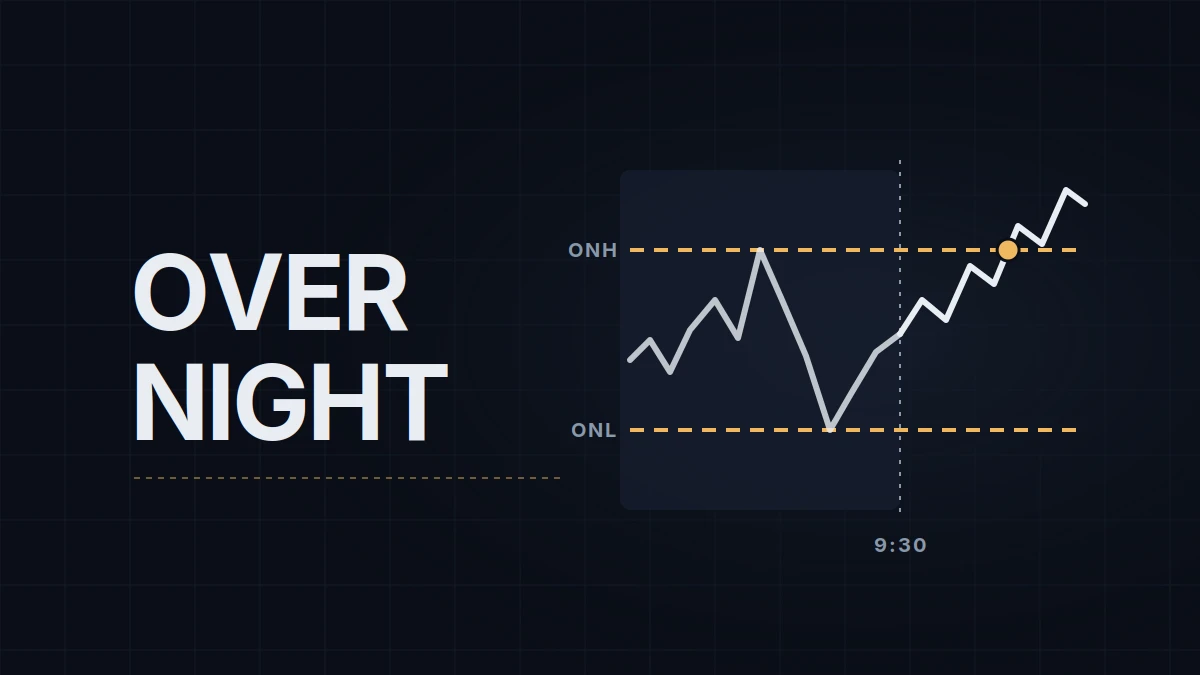
Between 2015 and 2025, NQ's cash session traded through the overnight high or the overnight low on 94 days out of 100, and on half of those days the first break came within 11 minutes of the 9:30 AM ET open. The night doesn't decide the day. It draws the lines the day starts by testing, and it leaves the market leaning one way or the other before the first cash trade prints.
For the E-mini Nasdaq-100 future (NQ), the overnight session runs from the 6:00 PM ET Globex open to the 9:30 AM ET cash open that starts regular trading hours (RTH), 00:00 to 15:30 CEST. What moves NQ in each part of the night, Asia, Europe and the 8:30 AM data hour, is covered in NQ trading sessions, and how to mark the overnight high and low in key levels. Point values for NQ and the Micro (MNQ) are in the futures pillar. This post is about the handover at 9:30.
A range built on a sixth of the volume
For the E-mini S&P 500, New York Fed researchers put the overnight share of volume at about 16% for 2021 to 2025. Nobody publishes the same figure for NQ, but any NQ volume chart shows the shape: thin bars through the night, the tallest bars after 9:30. So the overnight high and low are prices the market reached while most of the day's participants were away, which is why the cash session goes back to check them so quickly.
What the cash session does with the night
A vendor study at tradingstats.net covered 2,827 NQ sessions from January 2015 to December 2025, with the overnight defined as 6:00 PM to 9:30 AM ET and the cash session as 9:30 AM to 4:00 PM ET:
| After 9:30 AM ET, the cash session broke... | Share of sessions |
|---|---|
| Only the overnight high | 38.7% |
| Only the overnight low | 32.6% |
| Both | 22.9% |
| Neither | 5.8% |
Two numbers from the same dataset matter more than the totals. When the cash session opened above the midpoint of the overnight range, the high was the first side to break 76.2% of the time; when it opened below the midpoint, the low went first 75.6% of the time. And once one side broke, the other followed on only about one day in four (24.0% after the high went first, 24.5% after the low).
Read together, a break of an overnight extreme describes an ordinary day, not a signal: it happens on 94% of sessions, so on its own it can't tell one kind of day from another. The information is elsewhere. Which side goes first, which the open already hints at; whether the other side follows, which it does one day in four; and what price does right after the break, holding beyond the extreme or coming back inside. Level traders spend the first hour on that last question.
Inventory and the gap
Profile traders describe the lean as inventory. If most of the night traded above yesterday's close, the overnight crowd goes into the open net long, and some of those positions get cut in the first minutes, which can pull price back toward the middle of the range before anything else happens. The 76% above has a plainer explanation, distance: an open above the midpoint sits closer to the high than to the low, so the high is the nearer thing to hit. Inventory is a reason to expect a wobble after the open, not a reason to expect the far side first.
A gap is the other half of the handover: the distance from yesterday's 4:00 PM ET cash close to today's 9:30 open, which takes in the hour NQ keeps trading after the close as well as the night. In the same dataset, a gap up sent the high first 68.9% of the time and a gap down sent the low first 69.2% of the time. What gaps do for the rest of the session, and how often they fill, is its own post, NQ gap fill.
How wide was the night?
Measured against the average daily range (ADR) of the last 14 sessions, taken from full-session daily bars that include the night, the width of the overnight range gets read two ways, and they point in opposite directions. The arithmetic reading says a night that already covered most of an average day's range leaves less for the cash session. The volatility reading says wide nights come on volatile days, so the day's range will be wider than average anyway. Both hold some of the time: volatility clustering is one of the best-documented patterns in markets, and the arithmetic holds on ordinary days.
| Overnight range vs ADR | What it tends to mean | What to watch after 9:30 |
|---|---|---|
| Narrow, under about a quarter | The night found little; most of the day's range is still to be built | The first extreme to break, and whether price holds beyond it |
| Middle, a quarter to a half | An ordinary night; the extremes are levels like any other | Where the open sits against the midpoint |
| Wide, over about a half | A volatile day more often than a finished one | Whether the open sits near one extreme of the night or back near its midpoint |
Those cut-offs are rules of thumb, not the result of a backtest. The only published breakdown by width I could find, again from tradingstats.net, uses a different window from the rest of this post: it measures the range from 6:00 PM to 6:00 AM ET and counts touches from 6:00 AM to 4:00 PM ET, and across the four markets in that study roughly 70% of midpoint touches came before the 9:30 open. On NQ, the midpoint of that range was touched on 86.3% of sessions after the narrowest third of nights and on 78.9% after the widest third. Their other study, the one using 6:00 PM to 9:30 AM, puts the median overnight range for 2015 to 2025 at 90.5 NQ points, but that figure mixes very different price levels: the same site puts NQ's typical daily range at about 80 points in 2015 and about 500 in 2026, which is why the cut-offs above are fractions of the ADR, not points.
Reading the night at 9:30
Four things, in the order they become available:
- Mark the overnight high, low and midpoint, and note when each extreme was set; a high printed on an 8:30 AM data release is a different level from one printed at 2:00 AM.
- Note where the open sits: above or below the midpoint, inside or outside yesterday's range, and how big the gap is.
- Compare the width of the night with the average daily range.
- Watch the first break: which side, how soon after the open, and whether price holds beyond it or comes back inside.
My own window, 9:00 to 15:30 CEST, sits inside what this post calls the overnight, so I work with its pieces rather than the finished range: the Asian high and low from before my session, the previous day's London range and yesterday's cash-session levels. The full overnight high and low only become a finished pair at 15:30, when I stop.
Educational content, not investment advice. Futures trading involves substantial risk of loss. Examples are for illustration only. Read the full Risk Disclosure.