NQ Gap Fill: Overnight Gaps, Fill Rates by Gap Size and What the Statistics Leave Out
Three in five NQ opening gaps close the same day, and the average hides almost everything. Fill rates by gap size, how fast fills happen, which contexts move the odds, what a fade costs on one micro, and why the previous close depends on your platform.
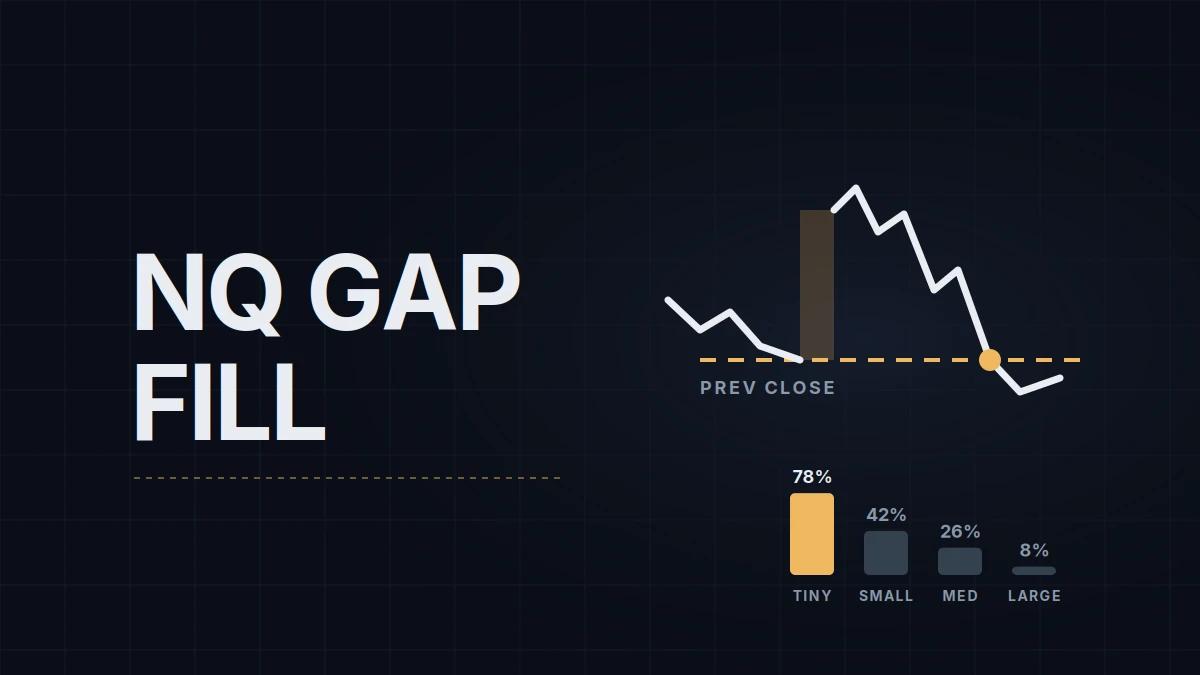
Across 2,791 sessions of E-mini Nasdaq-100 futures (NQ) between January 2015 and December 2025, the opening gap closed completely on the same day 60.3% of the time. That number is where the saying "gaps always fill" comes from, and the same data shows why the saying misleads: tiny gaps filled almost four times in five, large ones fewer than one time in ten. The NQ gap fill figures below come from a published study by TradingStats, and what one point of any of these moves is worth on NQ and MNQ is in the contract pillar.
A gap on a market that barely closes
NQ trades from 6:00 PM ET on Sunday to 5:00 PM ET on Friday, with a one-hour halt each afternoon, so a full-session chart has almost nothing to gap across. Real holes appear in two places: over the weekend, and after the daily halt when news landed during that hour. What traders call "the gap" is something else. It is the distance between yesterday's regular-session close and today's regular-session open at 9:30 AM ET / 15:30 CEST, and everything that traded overnight on Globex sits inside it. On a chart set to regular trading hours (RTH) it looks like a hole; on a full-session chart it is simply the overnight move. The sessions post covers the windows.
That makes "yesterday's close" a choice, and platforms don't agree on it. TradingView's RTH view of CME futures ends at 4:15 PM ET. NinjaTrader's "CME US Index Futures RTH" template runs to the CME close at 5:00 PM ET in recent versions (check yours under Tools › Trading Hours). The study uses the 4:00 PM ET cash-market close. On a day when NQ moves 20 points after 4:00 PM, the same gap has two sizes and sometimes two outcomes, so pick one definition and keep it.
Fill rate by gap size
A gap of 100 points means one thing in a quiet month and another in a volatile one, so the study measures size against the 14-day average true range (ATR): the average distance between each day's high and low, counting any gap from the prior close.
| Gap size (vs 14-day ATR) | Days | Share | Filled by the close | Median time to fill |
|---|---|---|---|---|
| Tiny, under 0.3× | 1,711 | 61% | 77.8% | 7 min |
| Small, 0.3× to 0.7× | 690 | 25% | 42.0% | 74 min |
| Medium, 0.7× to 1.2× | 241 | 9% | 25.6% | 122 min |
| Large, over 1.2× | 149 | 5% | 8.2% | 143 min |
| All gaps | 2,791 | 100% | 60.3% | 18 min |
NQ RTH sessions, January 5, 2015 to December 30, 2025. Median times count only the gaps that filled. Source: TradingStats.
To turn the tiers into points, use the ATR on your own chart. With a 14-day ATR of 400 points (a round number for the arithmetic, not a reading), a tiny gap is anything under 120 points, small runs to 280, medium to 480, and anything beyond is large. Six sessions in ten open with a tiny gap, and that is what carries the blended 60%: most gaps are small enough for the first minutes of trading to cover.
When fills happen
Fast or not at all. In the same data, 43.3% of all gaps were fully closed by 10:30 AM ET, the end of the initial balance, 51.9% by noon and 60.3% by the close. Of the gaps that filled, seven in ten did it in the first hour, and the whole afternoon added 8.4 percentage points. Partial fills come quicker still: the median gap covered a quarter of its distance within a minute of the open and half within five.
Context moves the rate almost as much as size. An open inside the previous day's range filled 70.4% of the time, against 47.1% for an open above it and 44.1% below it. Monday gaps filled 53.9%, the lowest of the week, which fits a weekend gap carrying two days of news. Low-volatility stretches filled a little more often than high-volatility ones (63.2% against 56.3%), gap downs a little more than gap ups (62.2% against 58.8%). The rarest context produced the most striking figure: when the overnight session had already moved against the gap, the fill rate was 83.3%, from only 30 cases.
What the percentages leave out
A fill rate is not a trade. The study also measured how far price moved the wrong way before the fill, the maximum adverse excursion (MAE) covered in the MAE and MFE post. The median was 0.34 ATR, the 75th percentile 0.62 ATR and the 90th percentile 0.97 ATR. With the 400-point ATR from above, that is 136, 248 and 388 points: $272, $496 and $776 on a single Micro E-mini Nasdaq-100 (MNQ). A stop wide enough to survive nine fills in ten would use most of the $1,000 drawdown a typical 25K prop evaluation allows at the time of writing, on one micro. Tiny gaps run smaller, about a third less at both the median and the 90th percentile, but not small.
The point figures in any study that starts in 2015 average years when the index traded at a fraction of its current level, which is why the ATR ratios are the numbers worth carrying forward. The most impressive combinations in gap research, such as a tiny gap plus a first 15-minute candle heading toward the fill (93.1% in this data), were found by testing many filters on the same history, and a rule found that way usually does worse on sessions it wasn't found on. And 10.1% of days were whipsaws: price ran far enough against the fill to stop out a fade, then filled anyway.
Three ways traders use the numbers
Fading means trading from the open toward the previous close. It is the approach the statistics flatter, and its cost is the MAE above: the stop has to be wide, or the trade gets taken out on the days it would have worked. The version the data supports best is narrow: tiny gaps that open inside the previous range, with a target no bigger than the gap.
Trading with the gap reads the other half of the table. Large gaps, and gaps that open outside the prior range, stayed open more often than not, so some traders treat them as trend-day candidates and look for a pullback that holds. The cost is the minority that do reverse, and they rarely reverse gently.
Waiting for confirmation, a first 15-minute candle or an opening-range break in the direction of the fill, buys a better hit rate with a worse entry, since part of the distance is gone before the trade starts. And some traders use none of it as a setup and simply keep the previous close on the chart as one more level, next to the ones in the key levels post.
My trading day is mostly done by the time the cash market opens at 15:30 CEST, so the fill itself isn't something I trade. The table is still useful from the European side: when the morning has pushed NQ far from the previous close, the odds say a full round trip before noon New York time is the less likely outcome.
Educational content, not investment advice. Futures trading involves substantial risk of loss. Examples are for illustration only. Read the full Risk Disclosure.