The A-to-C Game Analysis: Mapping Recurring Trading Mistakes Before They Cost Money
A month of trading is usually decided by its worst three days, not its best five. Jared Tendler's A-to-C game analysis writes down what your best, average and worst trading look like, mental and tactical, so the worst can be recognized while it's happening. A worked grid and how to build yours.
Five good sessions at +$300, twelve ordinary ones at +$50 and three bad ones at -$600 make a month of +$300. Make every good day 20% better and the month becomes +$600. Leave the good days alone and turn two of the bad ones into ordinary days, and it becomes +$1,600.
| Month (hypothetical, 20 sessions) | A days | B days | C days | Result |
|---|---|---|---|---|
| As it is | 5 × +$300 | 12 × +$50 | 3 × -$600 | +$300 |
| A days 20% better | 5 × +$360 | 12 × +$50 | 3 × -$600 | +$600 |
| C days half as bad | 5 × +$300 | 12 × +$50 | 3 × -$300 | +$1,200 |
| Two C days become B days | 5 × +$300 | 14 × +$50 | 1 × -$600 | +$1,600 |
That asymmetry is the argument behind the A-to-C game analysis from Jared Tendler's The Mental Game of Trading, which the book review covers as a whole. You write down what your best, average and worst trading look like in enough detail to recognize the worst while it's happening, and you work on the back end first. It closes the General topic, which starts from reading a price chart and spends its later posts on process; this one assumes you already have a method and keep breaking it.
A range, not a level
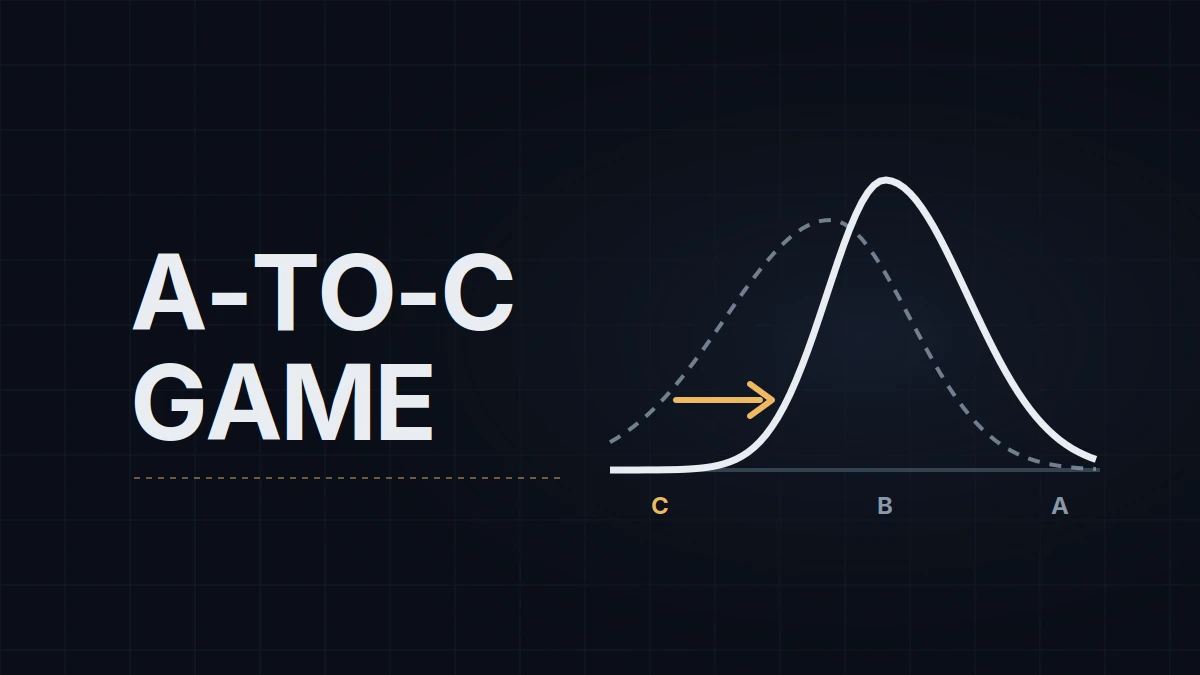
Tendler treats performance as a range, a bell curve running from your worst trading to your best, and describes improvement with the image of an inchworm: the front end (your A-game) stretches forward, then the back end (your C-game) has to catch up. Traders who only push the front get better peaks and the same disasters, so the range widens and the results swing. Moving the back end is slower and duller, and it's what changes the month, as the table shows.
On a prop account the back end matters even more. A -$600 day on a 25K evaluation with a $1,000 max loss limit (a common public rule at the time of writing) uses 60% of the account's room in one session. A C-game there doesn't just cost money; it ends the account.
The analysis is built one item at a time: for each skill or recurring problem, you describe what it looks like in your A-game, your B-game and your C-game, in terms you could recognize from outside. The book doesn't sort the items into categories; I find it useful to, into the mental side, what you think and feel (the sentences in your head, the urges, what you look at), and the tactical side, what you do on the chart (entries, stops, size, timing), and the grid below is grouped that way for readability. Either way it is a different tool from grading setups A, B and C, which rates the opportunity the market offered; the A-to-C analysis rates the trader taking it. An A setup taken in C-game is common, and it's one of the more expensive combinations there is, because the setup gives the trader permission.
A worked grid
This is a hypothetical NQ day trader, an E-mini Nasdaq-100 futures trader working a level-based method, not anyone's real map. Read it for the kind of sentence that belongs in each cell.
| Level | Mental | Tactical |
|---|---|---|
| C-game | "It has to come back." Counting the day's P&L after every trade. Anger at the market after a stop. The day's target starts to feel owed. | Re-entry within two minutes of a stop, with no new level. Stop moved away from price. Size up after a loss. A trade taken inside the ten minutes before a scheduled release. |
| B-game | Impatience in slow markets. Thinking about the result of the trade instead of the level. A little bored, looking at a faster chart. | Entries a few ticks before the level. Taking a thin setup because nothing better came. Closing a winner by hand before the trail does it. |
| A-game | Waiting feels like work, not like missing out. A loss registers as a cost of the method. Attention on the level and on price behavior there. | Entries only at levels marked before the session. Stop placed by structure before entry, left alone. Flat before the release. The trail runs untouched. |
Notice that most of the B row is a mild version of the C row. That's typical, and it's useful: a B item appearing is often the earliest point at which the C item that follows can still be stopped.
Building yours
Start from the back. Take the last 20 to 30 sessions in your journal, pick the three worst, and for each one write down what happened in the ten minutes before the first bad trade: what you thought, what you looked at, what you did. Use the words that were in your head. "It has to come back" is something you'll recognize at 10:05 in the morning; "was emotional" isn't.
Tactical items have to be checkable against the trade log. "Re-entered within two minutes of a stop without a new level" can be counted; "was impatient" can't. If your journal has an error tag field, as the one in the journal post does, name the tags after your C items so the monthly count is a filter, not an argument.
The B column is where most sessions live, so describe it accurately rather than kindly. The A column comes last and can be short; you already know what good looks like, and it's the C column you'll read before the open.
Three to six items per cell is enough. More than that and you won't read it before the session, which is the only time it does anything. The one-page trading plan has a pre-session section where the C column fits.
Update it once a month. Items that stopped appearing move out, new ones appear, and something that was C-game six months ago often shows up as B-game now, which is progress you'd otherwise never see because the P&L is too noisy to show it.
From the map to a correction
The map tells you where a mistake starts. Fixing why it starts is a separate tool, which Tendler calls the Mental Hand History: five written questions answered away from the screen. What exactly is the problem? Why does it make sense that you have it? What's flawed in that logic? What's the correction? Why is the correction correct? The answer to the fourth question is the sentence you read when a C item shows up mid-session, and it works only if it was written by the calm version of you beforehand. The review goes through the mapping side, with intensity levels and triggers, in more detail.
The psychology module in the WotT journal keeps this grid as data, with triggers, signals, intensity and corrections stored next to the trades they came with. A notebook works just as well. What matters is that the C column gets read before the first trade, every session, in about two minutes.
Educational content, not investment advice. Futures trading involves substantial risk of loss. Examples are for illustration only. Read the full Risk Disclosure.