Grading Setups A, B and C: A Framework for Taking Fewer, Better Trades
A journal that logs every reversal as "reversal" averages a 65% trade with a 40% one and calls the result a strategy. Five criteria that separate an A from a C at the same level, three ways to turn them into a grade, what to do with the grade at entry, and how many trades it takes to trust it.
Two trades with the same name are not the same trade. A reversal at the previous day's high taken into a trend, at 10:40 AM ET, with a rejection bar and 30 points of room to the next level, and a reversal at the same high taken against a trend, three minutes before a data release, with no rejection and a level 8 points away, both get logged as "PDH reversal", and a journal that averages them reports one win rate for two different bets. Trade setup grading is the fix: a short list of criteria checked before the entry, and a letter that records how many of them the trade had. The letter does two jobs. At entry it decides whether and how large to trade; after 50 trades it tells you whether your B setups are a smaller A or a coin flip. The vocabulary here (levels, structure, bars) is the one the chart pillar builds from zero.
What goes into a grade
The criteria are the ones your setup already depends on, written down so that each is a yes or a no. Five is a workable number; more than seven and the grading takes longer than the trade.
| Criterion | Yes | No |
|---|---|---|
| Location | At a level marked before the session: PDH/PDL, value area edge, overnight high or low | In the middle of the range, or at a level found after price got there |
| Context | The trade is with the day's structure (a pullback in a trend, a fade inside a range) | Against it |
| Confirmation | The bar or the tape did something at the level: rejection wick, absorption on the heatmap, a failed break | Price is at the level and nothing has happened yet |
| Time | Inside the planned window, with no high-impact release in the next 15 minutes | Outside it, or into the release |
| Room | The next level is at least 1.5R away, so a normal target is reachable | A level sits between entry and target |
Location and confirmation are the two most traders put first, and for a level-based method they are the ones that decide most of the outcome; the support and resistance post explains why a level found in hindsight is not a level. Time and room are the ones people leave out and then discover in the journal, usually as a cluster of losers between 8:25 and 8:35 AM ET.
Three ways to turn criteria into a letter
Additive. Count the yeses. Five is an A, four a B, three or fewer a C. Simple, and it treats a missing confirmation the same as a missing 1.5R of room, which is the objection to it.
Gated. Two criteria are gates, usually location and confirmation, and a trade that fails either is a C whatever else it has. Among trades that pass both gates, the remaining three decide between A and B. This matches how most level traders think about their setups: no level, no trade, and then quality on top.
Weighted. Each criterion carries a score (location 3, confirmation 3, context 2, time 1, room 1, say), and thresholds turn the sum into a letter. The most precise and the easiest to fiddle with, because a weight is a parameter and parameters get optimized to fit last month.
The gated version is the one to start with. It has no numbers to tune, it says out loud which two things your method can't do without, and it is what the examples below use.
The same level, three grades
Take a marked previous-day high on the E-mini Nasdaq-100 with price coming up into it during regular hours, the day trending up, and a reversal short as the setup.
An A: price pushes 4 points through the high and closes back below it on a bar with a long upper wick, the heatmap shows sellers absorbing the push, it is 10:40 AM ET with nothing on the calendar until 2:00 PM, and the nearest level below is the value area high, 32 points away. Every criterion is a yes except context, since the short is against an up day, and the gated rule doesn't count context as a gate. Some traders would call this a B for that reason, and either is defensible as long as the journal records the same answer every time.
A B: same level, same rejection bar and absorption, 10:40 AM, but the overnight high sits 9 points below the entry. Location and confirmation pass the gates; room fails. The trade is real, the target is shorter than the one the setup usually gets, and the grade says so before the entry rather than in the post-mortem.
A C: price arrives at the high at 8:27 AM ET, no rejection yet, the bar is still forming, and the 8:30 release is three minutes away. Location passes; confirmation doesn't, and neither does time. This is the trade that looks like the A one on a screenshot taken an hour later, after the release rejected the level, and it is the reason the grade has to be written down before the outcome exists.
What the grade does at entry
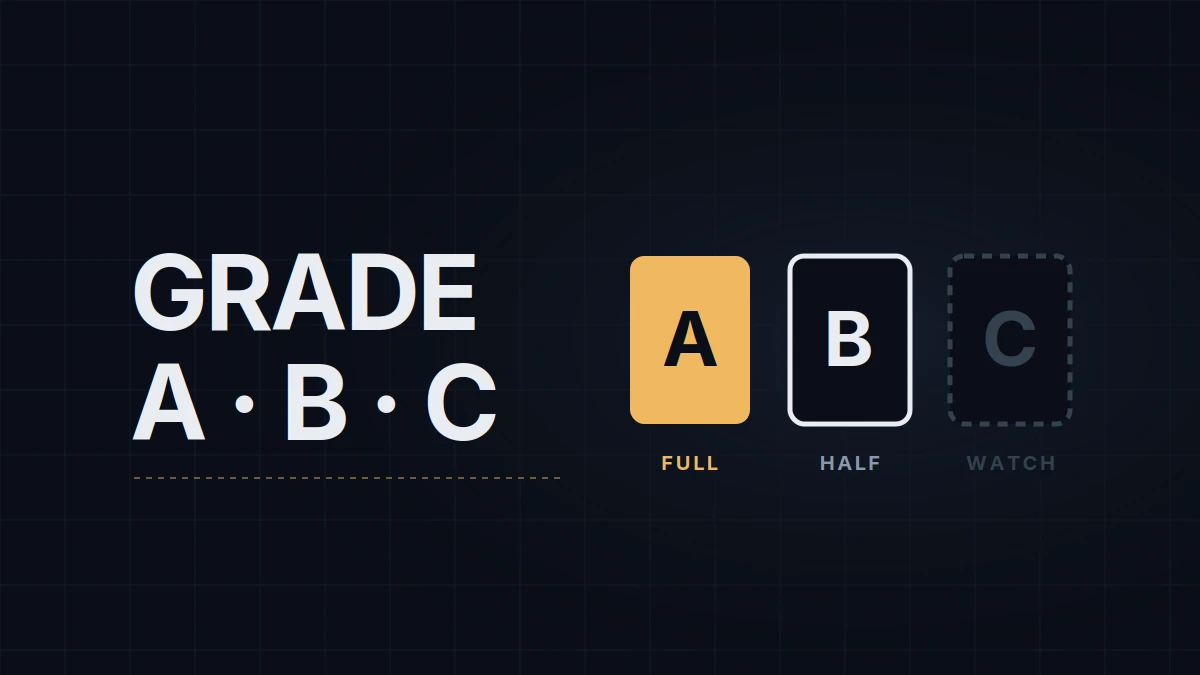
There are two schools. Size by grade: full size on an A, half on a B, none on a C. The trader keeps taking B trades, learns what they pay, and the journal fills with data on both grades. A only: B and C are watched and logged as no-trades; the trade count falls, the average quality rises, and the B data comes from observation rather than from money. Either is a rule a one-page plan can hold in a single line, and the failure mode of both is the same: grading after the entry, when the position is already on and the letter gets bent toward what the trade needs it to be. The grade is a field written in the journal at the moment of the click, next to the screenshot.
After about 50 trades of a grade the numbers begin to mean something. Group the journal by grade and compare win rate and average result in R, the same arithmetic as the expectancy post. Three outcomes are common. B is a smaller A (a lower win rate, a positive expectancy) and deserves its half size. B is a coin flip and deserves to become a no-trade. Or, the awkward one, B does as well as A, which means one of the criteria isn't doing any work and the list can lose it. The MAE and MFE distributions by grade tell the same story from the other side, since a grade that exists only on paper produces the same excursions as its neighbor.
A gallery helps more than a spreadsheet at the start: one screenshot per grade per setup, with the criteria ticked on the image, so that the next trade is compared against a picture rather than a memory. I keep mine in the Playbook of the journal I use, and the rule at the desk is gated, A at full size, B at half, C watched. The list has changed twice in a year, both times because the 50-trade table said one criterion was decoration.
Educational content, not investment advice. Futures trading involves substantial risk of loss. Examples are for illustration only. Read the full Risk Disclosure.