Candlestick Patterns That Matter and Those That Don't, With Base Rates
Most famous candlestick patterns land near a coin flip when counted, and the few with big numbers owe part of them to where the pattern closed. Bulkowski's figures read by shape instead of name, the base rate every hit rate needs, and what tests on intraday futures found.
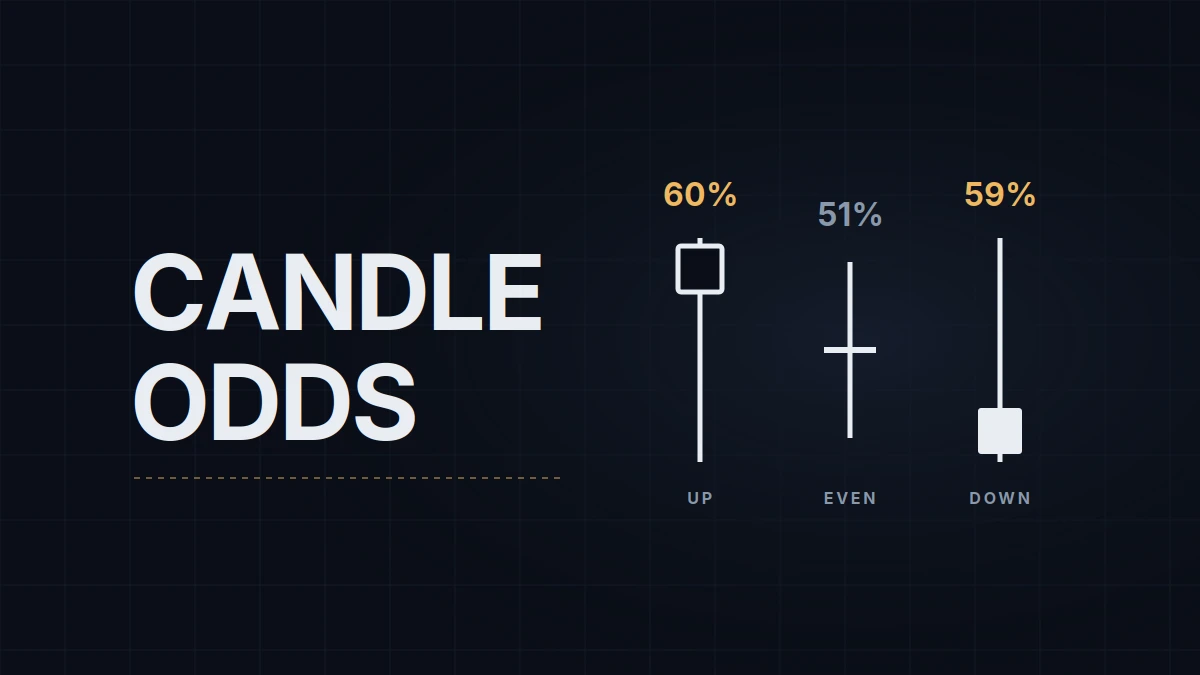
Do candlestick patterns work? Counted the way their own statistics count them, most of the famous ones land near a coin flip, and the few with impressive numbers owe part of them to something their names don't mention: where the pattern closed. Candlestick pattern reliability is a question about base rates, how often the outcome happens with no pattern at all, and the base rate is the number pattern books tend to leave out.
The shapes themselves, the doji, the hammer, engulfing bars and inside bars, are drawn and defined in how to read a price chart. This post is about what they're worth.
The base rate comes first
A base rate is how often the outcome happens anyway. From 1951 through 2025 the S&P 500 closed higher than the day before on 53.7% of trading days, according to Crestmont Research, so a bullish pattern followed by an up day 55% of the time has added 1.3 points, not five. Every claim needs the base rate for its own outcome, measured the same way, and a hit rate quoted without one can't be read. On short intraday bars the market's upward drift is spread so thin that the base rate for the next bar closing higher sits close to even, with a share of bars closing unchanged, which leaves a pattern very little room to stand out.
What the best-known count says
Thomas Bulkowski's Encyclopedia of Candlestick Charts (2008) is the best-known public count: about 4.7 million daily candles from hundreds of US stocks, going back to the 1980s. His main measure is the direction of the first close outside the pattern, above its high or below its low.
| Pattern | What it records | Where it closes within the pattern | First close outside the pattern |
|---|---|---|---|
| Hammer | long lower wick after a decline | near the top | up, 60% |
| Hanging man | the same shape after a rise | near the top | up, 59% |
| Shooting star | long upper wick after a rise | near the bottom | down, 59% |
| Inverted hammer | a tall down bar, then a small body with a long upper wick | near the bottom | down, 65% |
| Bullish engulfing | an up body covering the prior down body | near the top | up, 63% |
| Bearish engulfing | a down body covering the prior up body | near the bottom | down, 79% |
| Doji (northern, southern, long-legged) | open and close at nearly the same price | not fixed (the middle for long-legged) | up, 51% to 52% |
| Harami, the body version of an inside bar | a small body inside the prior one | inside the prior bar | up, 53% (both versions) |
| Three black crows | three down bars closing near their lows | at the bottom | down, 78% |
Figures from Bulkowski's pattern pages at thepatternsite.com, daily bars on US stocks.
The shape predicts better than the name
Read the table by shape instead of by name. The hammer and the hanging man are the same candle, a small body at the top of a long lower wick, and textbooks give them opposite meanings: the hammer is supposed to reverse a decline and the hanging man to end a rise. Both broke upward about 60% of the time. The shooting star and the inverted hammer both close near the bottom of their range (Bulkowski's inverted hammer adds a tall down bar before the wick), and both broke downward, 59% and 65%, whatever the textbook reading.
The direction tends to follow the close. A pattern that closes near its high starts closer to its own top than to its bottom, and a price path that starts there leaves through the top more often even when the bars that follow are random. Across the table the numbers roughly track how far the close sits from each edge of the pattern: 51% to 52% for the northern, southern and long-legged doji, whose definitions don't put the close near either edge, up to 78% and 79% for three black crows and the bearish engulfing, which close at or near the bottom. The two doji that close at an extreme follow the same rule: Bulkowski notes that upward breakouts predominate after the dragonfly, which closes at its high, and that the gravestone, which closes at its low, breaks downward most often. It isn't a law, though: the bullish and bearish engulfing patterns are mirror images, and one broke in its direction 63% of the time, the other 79%. Still, part of each figure is geometry, and the fair comparison for a hammer would be a random bar that closed at the same point in its range. Bulkowski's pages don't print that comparison, which is why a 60% can't be read as an edge. He puts it bluntly himself: "I consider a success rate of 60% as too close to random to be tradable."
Some of the high numbers also come from rare patterns. Three black crows appeared about 2,660 times in 4.7 million candles, roughly once in 1,800 bars, which on one daily chart is about once in seven years.
What tests of trading them found
A direction count is one thing, and a trading rule after costs is another. That's where most academic tests land, and the results lean one way. Marshall, Young and Rose (2006) found no value in candlestick strategies on Dow Jones stocks from 1992 to 2002, and a follow-up by Marshall, Young and Cahan (2008) found none in 30 years of Japanese stocks. Fock, Klein and Zwergel (2005) tested intraday bars on DAX and Bund futures and found no predictive power from the patterns alone or combined with indicators such as momentum. Duvinage, Mazza and Petitjean (2013) tested 83 rules on five-minute bars of Dow stocks: about a third beat buy-and-hold before costs, only a few stayed profitable after costs, and none beat buy-and-hold after costs once the test corrected for data snooping.
Positive results exist. Caginalp and Laurent (1998) found profitable three-day reversal patterns on S&P 500 stocks from 1992 to 1996, and Lu, Shiu and Liu (2012) found three profitable bullish reversal patterns on Taiwanese stocks. They're the exceptions, and neither tested an intraday index future.
The ones that matter
A candle records the result of one period's auction. At a price where nothing is expected to happen, that result is noise. At a price where orders are expected to sit, the same shape carries information: a long lower wick at yesterday's low says sellers pushed through the level and weren't paid for it. The information comes from the level, and the candle is only how the chart shows it. That's why a rejection bar at a marked level is the version worth testing and a hammer in the middle of a range isn't, and why support and resistance does more of the work than any pattern name.
So the patterns worth reading are the rejection shapes and engulfing bars, read at a level. The ones that don't earn their fame are the same shapes anywhere else, dojis and inside bars treated as signals, and the rare multi-bar names whose numbers may be largely geometry.
Testing one yourself
A pattern claim can be checked in an afternoon, and four steps keep the check honest:
- Write the definition before looking at a chart: body size, wick length, where it has to print.
- Count every occurrence in a fixed period, not the ones you remember.
- Measure the same outcome for a control group: bars that closed at the same point in their range without the pattern.
- Subtract costs. On MNQ a tick of slippage each way is $1.00 a contract, 5% of a 10-point ($20) target before commissions.
NinjaTrader 8 has a built-in CandleStickPattern indicator that marks the common patterns, and a condition built on it can be tested in the Strategy Analyzer.
I mark levels on a time chart and execute on Range 30 bars, so the candles I read are the ones printed at a level. A Range 30 bar spans exactly 7.5 points, so it can show a rejection wick only in miniature; on that chart a rejection usually shows as the first bar that closes in the other direction, and no pattern name is involved.
Educational content, not investment advice. Futures trading involves substantial risk of loss. Examples are for illustration only. Read the full Risk Disclosure.