Reversal Trades at Key Levels: Confirmation, Invalidation and Where the Stop Goes
A reversal at a key level is three choices made before the trade: what confirms it, what proves it wrong and where the stop goes. The same short at yesterday's high entered three ways, with what each confirmation costs in points, in missed trades and in false starts.
Price rallies into yesterday's high, stalls for two bars and turns down. Ten minutes later it's either the reversal of the morning or a pause before the breakout, and nobody knows which at the moment of entry. What can be decided in advance is what would confirm the turn, what would prove it wrong and where the stop goes. That is most of reversal trading at support and resistance, and the three decisions are linked: the confirmation sets the entry, and the entry sets how far away the stop has to be.
Why price reacts at levels at all is covered in support and resistance, and the levels themselves, the prior day's high and low, the overnight range and the value area, in key levels on NQ. NQ here is the E-mini Nasdaq-100 future; tick and point values are in the futures pillar.
Three ways to confirm
Traders who fade levels mostly wait for one of three things. The table prices one hypothetical short at a prior day's high (PDH) of 29,400.00, entered each way.
| Rejection bar | Absorption | Failed break | |
|---|---|---|---|
| What you wait for | A bar that trades to or through the level and closes back below it | Aggressive buying printing into the offer at the level on the heatmap while the offer doesn't shrink and price stops rising | A bar that closes above the level, then a bar that closes back below it |
| Entry in the example | 29,391.75, after a bar with a high of 29,406.25 closes at 29,392.00 | 29,399.00, while the offer at 29,400 holds | 29,395.00, on the close back below, after a high of 29,414.50 |
| Stop | 29,409.00, above the bar's high | 29,405.00, above the level | 29,417.00, above the failed break's high |
| Risk | 17.25 points ($34.50 on one MNQ) | 6 points ($12) | 22 points ($44) |
| What it costs | A late entry, part of the move is gone before the bar closes, and the stop grows with the bar | Depth data, a heatmap and a subjective read; it comes before any bar confirms, so it's wrong more often | It needs the break first, so many reversals never qualify, and its stop is the widest |
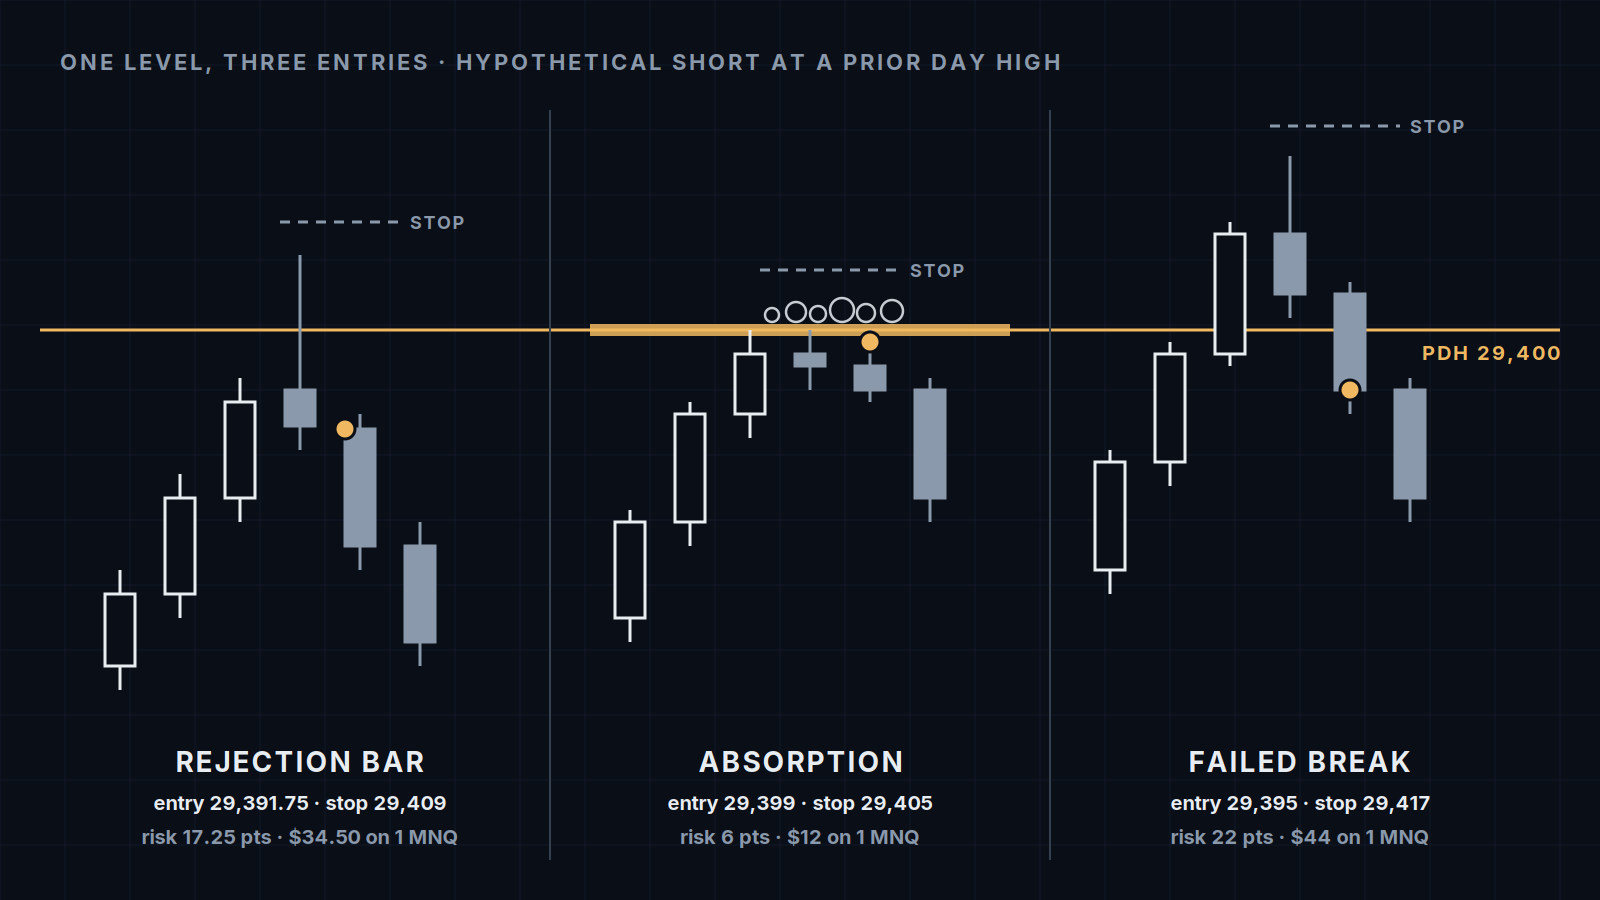
None of the three is better in general; they pay in different currencies. The rejection bar is the most common and the easiest to define on any chart, but the bar type decides what a rejection looks like. A five-minute bar can show a long wick above the level and a close well below it. A range bar can print that shape only in miniature: every completed bar spans exactly the set range and closes at its high or its low, so the probe above the level and the drop to the close have to fit inside one bar, 7.5 points on a Range 30 NQ chart. On a range chart the rejection is usually the first bar that closes in the opposite direction after the approach, and the wick the time-bar trader waits for is spread over two or three bars. Absorption gets the best price and the smallest stop and pays for it in false starts: an offer that holds for two minutes and is then pulled or eaten turns into the breakout: order flow shows the aggression, not whether the passive side will stay. It also needs a heatmap such as Bookmap and depth-of-book data. The failed break has the cleanest logic, because traders who bought the breakout are now trapped above their entries and their exits add to the move down, but it only exists on days when the level breaks first.
Invalidation comes before the stop
Invalidation is a market condition: the thing that, if it happens, means the level didn't hold. The stop is the order that enforces it, and writing the condition down first keeps the stop honest. For the rejection bar, it's a trade above the rejection bar's high: the probe that was supposed to be the extreme wasn't. For absorption, it's the offer at the level getting pulled or traded through, with price holding above it. For the failed break, it's price retaking the failed break's high, at which point the breakout was real after all.
The stop goes beyond the price that invalidates the idea, plus room for noise, not at the level itself. Levels get probed: a few ticks through yesterday's high is ordinary on NQ, and a stop placed exactly at the level gets taken by the same probe the reversal trader wants to fade. How much room depends on the morning's volatility, which is why the stop is situational rather than a fixed number of points (the average daily range post has the numbers behind that). The distance then decides the size, not the other way round: the stop belongs to the setup, the size to the account.
After the entry
A reversal that works tends to work quickly. If the level holds, the traders who pushed into it are wrong, and their exits add to the move; if price sits at the level for a long time, the level is being tested rather than defended. Many level traders add a time limit for that reason: no progress within a set number of bars, and the position is cut or reduced before the stop does it.
Where the trade is headed matters as much as where it started. The next level in the trade's direction is where it's likely to slow, and a trade with less room than the setup needs is one a minimum ratio to the next obstacle filters out, as the risk-reward post explains.
Two conditions change the odds before any of this starts. Scheduled data, most of it at 8:30 AM ET, can move price through any level in seconds, so a fade into a release is a different trade (high-impact news lists the times). And the options market can put a gamma wall right on top of a level, or nowhere near it; the gamma levels post covers when that adds a reason to the fade.
Which levels get faded
Not all of them. Levels marked before the session, touched for the first time that day, with nothing scheduled in the next half hour, make the usual shortlist; a level tested four times since the open is losing the orders that defended it. Two levels at the same price, an overnight high sitting on yesterday's value area high for example, count as one level that matters more.
My own reversals, KLR in my journal for key level reversal, wait for the chart: a failed break that reclaims, or a rejection, at a level I marked before the session, with the entry on the Range 30 execution chart. The heatmap is a veto rather than the trigger: absorption at the level says the trade is live, its absence says wait. The morning's gamma regime is a filter on top of that: on a negative-gamma day the size comes down or the setup waits. The exit starts from a target of about 35 points and turns into a trailing stop when the move has room for more, and the statistics stay in the journal until there are enough of them to mean something.
Educational content, not investment advice. Futures trading involves substantial risk of loss. Examples are for illustration only. Read the full Risk Disclosure.