MAE and MFE Explained: What Excursion Data Says About Your Stops and Targets
Every closed trade leaves three numbers behind; the account keeps one. Maximum adverse and favorable excursion, read on a 40-trade sample: which side of each histogram says something about the stop and the target, the cost of moving either, how to collect the numbers, and four ways they mislead.

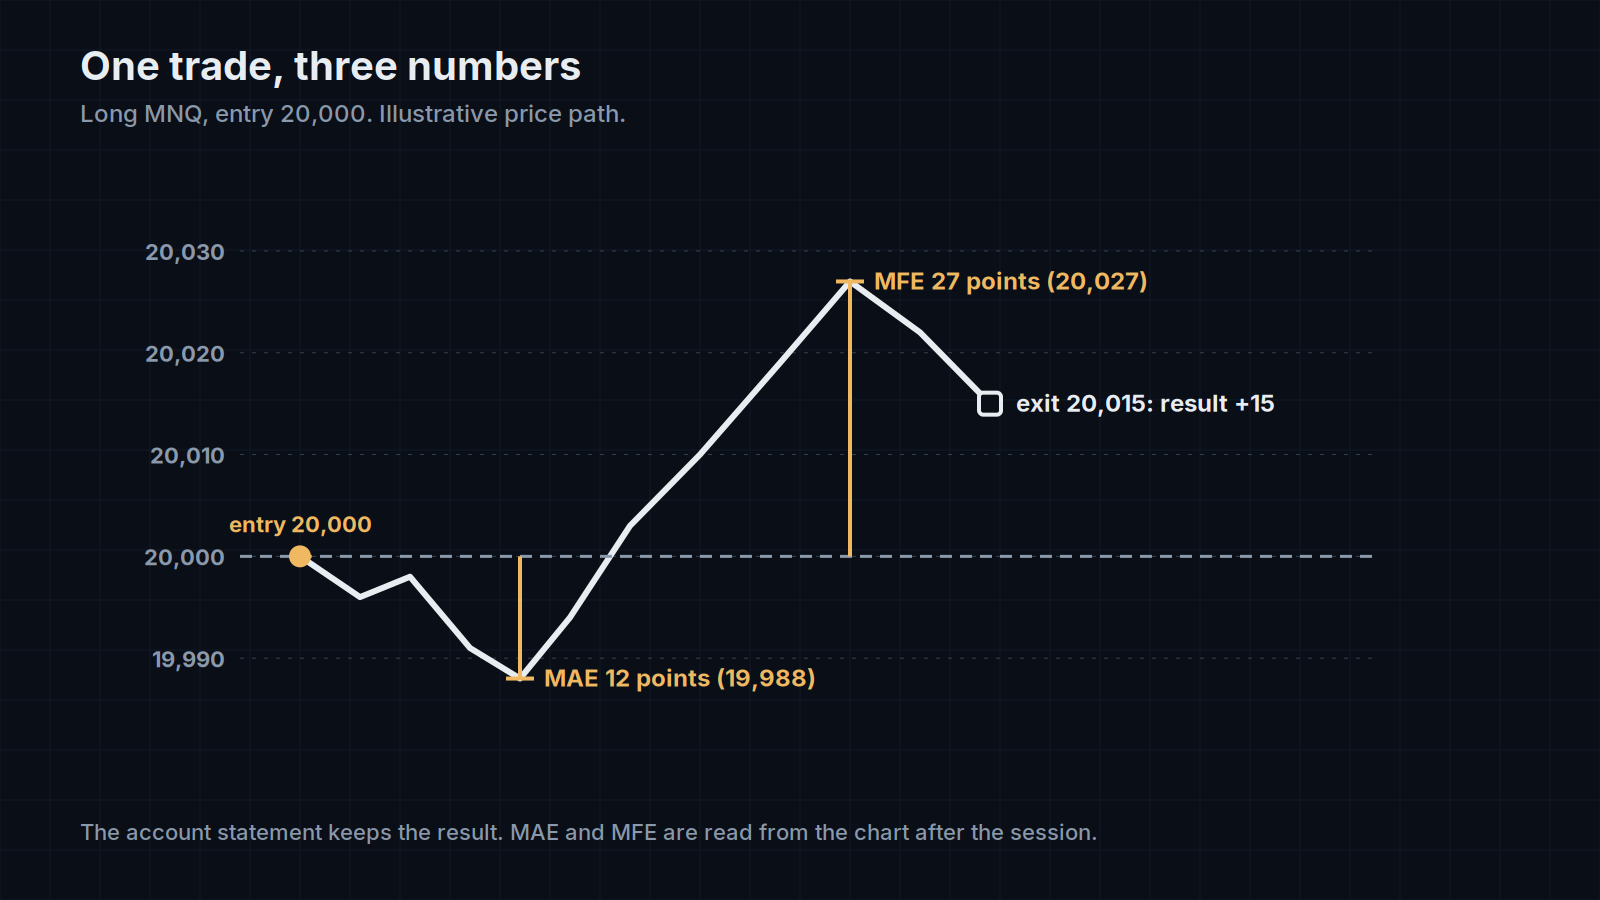
Every closed trade leaves three numbers behind. The result gets recorded. The other two, the furthest the trade went against you and the furthest it went in your favor, usually don't, and those are the two that say whether the stop and the target were in the right place. MAE, maximum adverse excursion, is the largest open loss a trade showed between entry and exit, measured in points from the entry price. MFE, maximum favorable excursion, is the largest open profit. A long entered at 20,000 that dipped to 19,988, ran to 20,027 and was closed at 20,015 has an MAE of 12 points, an MFE of 27 and a result of 15. The method comes from John Sweeney's 1996 book of the same name, and it is the cheapest analysis in trading: two extra fields in a journal, read off the chart after the session.
What follows uses a made-up sample: 40 MNQ trades of one setup, 22 winners and 18 losers, every trade with the same 20-point stop and every exit by a trailing stop. The numbers are constructed to show the patterns clearly. The method is what transfers to your own trades.
What the winners' MAE says about the stop
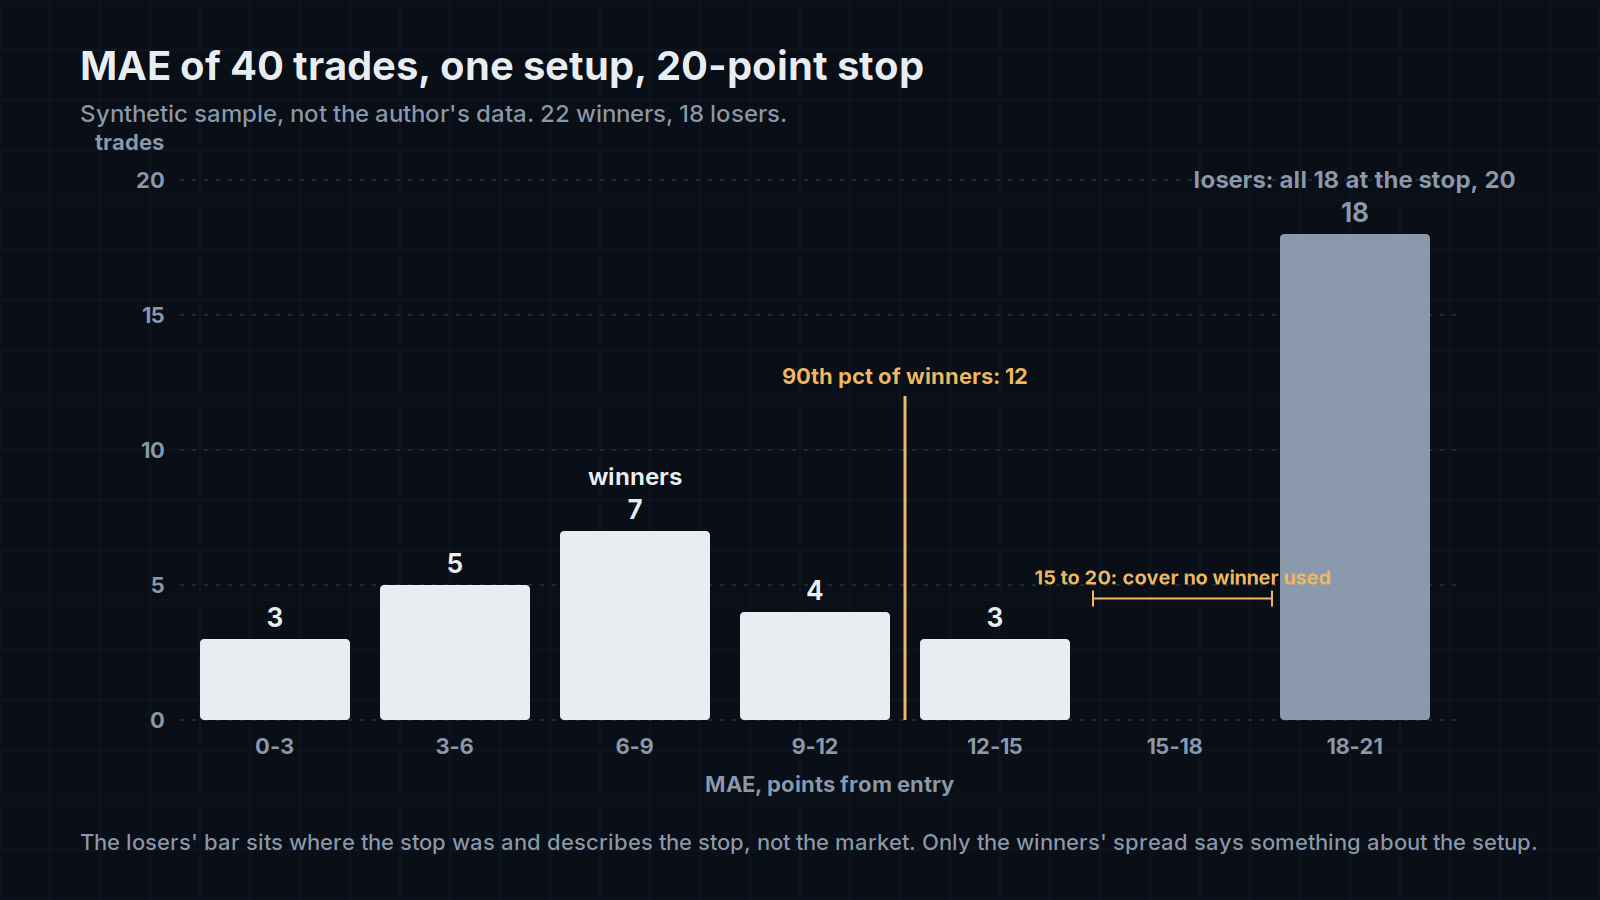
Sort the winners by MAE and the distribution is the whole argument. In the sample, half of the 22 winners never went more than about 6 points against the entry, three-quarters stayed inside 9, nine in ten inside 12, and the worst one reached 15 before it turned. Not one winner used the 20 points of stop it was given.
| Winners' MAE | Points |
|---|---|
| 50th percentile | 6 |
| 75th percentile | 9 |
| 90th percentile | 12 |
| Largest | 15 |
| Stop in use | 20 |
Two readings follow. The first is that the stop is paying for cover the winners never use: the 5 points between the worst winner and the stop exist only for losers to travel through. The second is the price of moving it. A 13-point stop would have kept 20 of the 22 winners and turned the other two into 13-point losses, and every one of the 18 losers would have lost 13 instead of 20. In points: the wide stop lost 18 × 20 = 360 on the losers; the tight one loses 18 × 13 = 234 on them plus 2 × 13 = 26 on the two winners it clips, 260 in all, so 100 points saved, against whatever those two winners made. If they averaged 25 points, the tight stop gives up 50 to save 100.
The 50 points over 40 trades matter less than what the smaller stop does to size. Risk per trade is the stop distance times the contracts, so at the same risk a 13-point stop buys half again as many contracts as a 20-point one, and every winner in the sample is then half again as large; the sizing post has the arithmetic. The MAE distribution is the evidence that the smaller stop fits the setup; the size is where the evidence gets paid.
Now the catch. The losers' MAE tells you nothing about the trades. Every loser in the sample has an MAE of 20 because that is where the stop was: the column describes the stop, not the market. What you would like to know, how many of those 18 would have turned at 22 or 30, is not in the data, and no amount of journaling recovers it. A stop censors the distribution at its own distance. The winners' MAE is the only side of the histogram that says something about the setup, and it says it only about entries that eventually worked.
What MFE says about the target
MFE splits the same way, and this time the losers' side is the informative one. A loser with an MFE of 1 point never worked. A loser with an MFE of 14 was a trade that worked and was given back, and the number of those in a sample is the case for a rule that protects open profit.
| Losers' MFE | Count of 18 |
|---|---|
| under 3 points | 6 |
| 3 to 8 | 5 |
| 8 to 15 | 5 |
| over 15 | 2 |
Seven of the 18 losers showed at least 8 points of open profit before turning and hitting the stop. A stop moved to breakeven at +8, a partial exit at +8, a trail that tightens once +8 prints: each would have taken those seven trades out of the loss column. Each has a cost on the winners' side, and the winners' MFE column is where to price it. A winner with an MFE of 40 and a result of 24 gave back 16 points; across the 22 winners in the sample the average give-back, MFE minus result, is 9 points. A trail tight enough to keep those 9 would have stopped some of the winners out at +8 on the way to +40.
So the two numbers to compute are the sum of MFE over the losers and the average give-back over the winners. When the first is large and the second small, the exit is leaving money on the table on losing trades and can be tightened. When the give-back is large, the trail is already close to the trade's noise, and the losers' MFE is the price of letting the winners run. Some traders compress the whole thing into one number per setup, the average MFE divided by the average MAE, both divided by the day's range so that days are comparable; Curtis Faith called it the edge ratio. Above 1 the setup offers more than it threatens. It's a summary, and it hides the shape that the two histograms show.
Collecting it without fooling yourself
The numbers are only as good as the collection, and the collection has five rules.
Record both in the same unit, points from the entry price, for every trade, including the ones closed by hand at breakeven in a hurry. Skip the boring trades and the distribution describes only the memorable ones.
Record per position, not per platform "trade". NinjaTrader reports an ATM with two targets as two trades with two MAE/MFE pairs, and a scale-in as several. One position, one MAE, one MFE.
Take the numbers from the chart or a session recording. On live accounts NinjaTrader 8's Trade Performance window reports MAE equal to MFE on most trades, a pair that can't exist; the export is unusable for this until that is fixed.
One setup per distribution. A reversal at a level and a breakout through it have different MAE shapes, and mixing them produces a histogram that describes neither. Thirty to forty trades of one setup is the point where the percentiles stop jumping around with each new trade; Market Replay is the fastest way to get there without paying for the sample in drawdown.
Note the day's range. An MAE of 12 on a day with a 150-point average daily range and an MAE of 12 on a 400-point day are different trades; if the sample spans both kinds of days, divide each excursion by that day's ATR before comparing.
Where the numbers mislead
- The stop censors. Every stop cuts the losers' MAE at its own distance and the winners' MAE at the same distance from above: a winner that would have gone 24 points against you is a loser in your data. Widen the stop and the winners' distribution grows a tail you couldn't see before.
- Moving the stop moves the trader. A stop calibrated to the 90th percentile of past winners changes how the next trades are entered and managed, and the next distribution is measured on a different trader. Recalibrate on the new sample, not the old one.
- One trade is one trade. In a sample of 22 winners the largest MAE is one entry; a stop set to cover it is a stop set by an anecdote. Percentiles are more stable than maxima, which is why the table above reports them.
- Time is missing. An MAE of 10 points reached in the first 30 seconds and one reached after an hour of grinding are different events, and a histogram flattens them into the same bin. If the recording is there, note when the worst point came, not only how far.
I read MAE and MFE per position from the session recording, in points, into two journal fields, and every few weeks I check the stop I've been using for each setup against the winners' MAE. The stop is still placed by structure, where the setup says it belongs; the distribution's job is to say whether that structure fits the trades I take or whether I've been buying cover the winners never claim.