Overfitting a Trading Strategy: Why the Best Backtest Is Often the Worst Bet
Test enough settings on any price history and one of them will look like an edge, even on data with no pattern in it. A simulation that shows how big that illusion gets, why every extra parameter makes it worse, and the checks that catch it before a live account does.
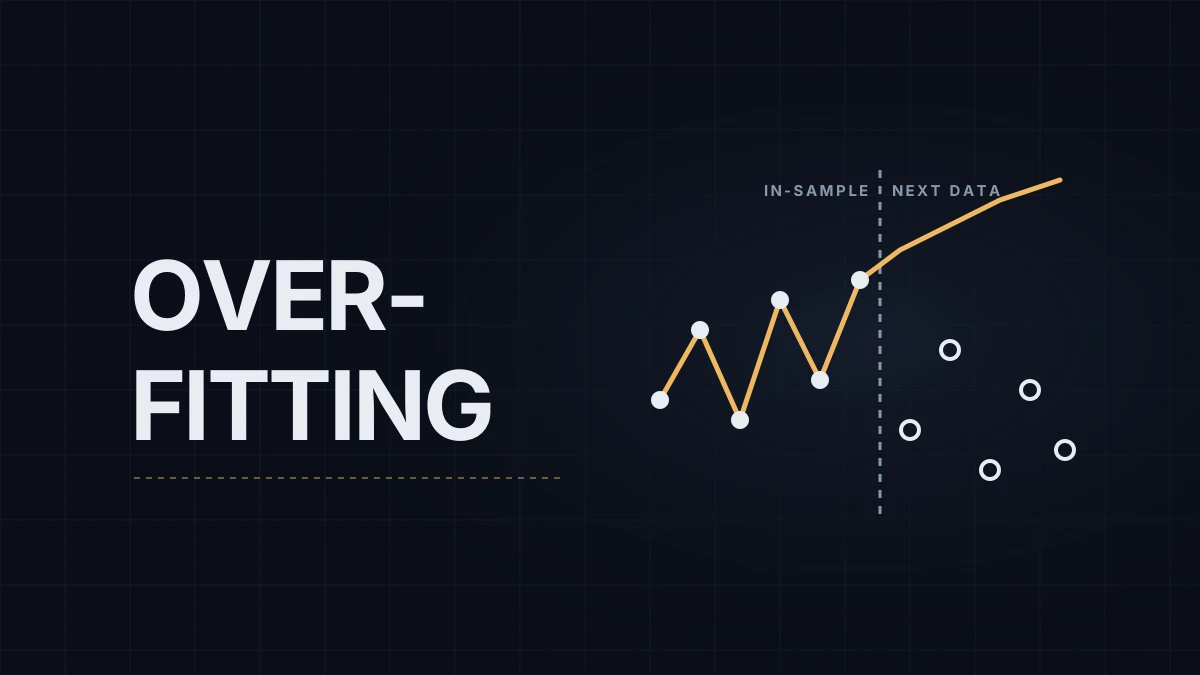
I generated 2,000 bars of random price, NQ-like in scale but with no trend and no pattern in it, and backtested 93 settings of a moving-average crossover on it, then repeated that 1,000 times on fresh data. The best setting made money in 95% of the attempts. Run on the next 2,000 random bars, that same winning setting made money 44% of the time. That gap is overfitting: a strategy fitted so closely to the history it was tested on that it describes the noise in that history rather than anything that repeats. It's one of the most common reasons a backtest looks better than live trading, and the easiest one to produce by accident. If price bars themselves are new, how to read a price chart is the place to start.
The strategy was always in the market, long when the fast average was above the slow one and short otherwise, with fast lengths from 2 to 20 bars in steps of 2 and slow lengths from 10 to 100 in steps of 10, and it paid half a point every time it switched sides, roughly a tick of slippage plus commission. Each time, the best of the 93 settings was picked on the first 2,000 bars and then run, untouched, on the next 2,000.
In-sample, the winning setting made a median of +420 points. Out of sample, the same setting made a median of −53, which is about what costs alone take from a strategy with no edge; the typical setting of the 93 lost a similar amount even in-sample. Across all the settings, how well one did on the first half said almost nothing about the second: the correlation was close to zero (0.04). At $2 a point on MNQ, the backtest promised about $840 per contract and delivered a small loss.
Why the winner is a mirage
Every backtest result is part skill and part luck. When you test one setting, the luck is as likely to flatter it as to hurt it. When you test 93 and keep the best, you're picking the one whose luck ran furthest in its favor, and that luck doesn't come along to the next sample. The more settings you try, the further the best one's luck runs, so the in-sample winner looks better and better while its future stays the same.
Parameters multiply the problem quickly. A strategy with a fast length, a slow length, a stop and a target, each tried at 10 values, has 10,000 combinations, and a five-option session filter on top makes it 50,000. With that many tries, a few hundred trades of history will contain a combination that looks excellent purely by chance. The number of trades in the test matters as much as the number of combinations; how many trades it takes to judge a setup shows how wide the uncertainty is on a sample of 50 or 100.
Overfitting also hides in decisions that never appear as parameters: dropping the year that didn't work, adding a filter after seeing which days lost, trying a different instrument when the first one disappointed. Each is another test, and each makes the final result a little less believable.
How to catch it
The cheapest protection is data you never look at. Set aside the most recent part of the history before you start, develop on the rest, and run the finished strategy on the held-back part once. If you go back and adjust after seeing that result, the held-back data has become in-sample too.
Walk-forward testing does the same thing repeatedly: optimize on one window, test on the next, move both forward, and judge only the stitched-together test windows. NinjaTrader's Strategy Analyzer has walk-forward optimization built in alongside the regular optimizer, and the regular optimizer is where most overfitting on that platform happens, since it will happily rank thousands of combinations by net profit. Backtesting in the Strategy Analyzer covers both.
Look at the neighbors of the best setting as well. If a 12/50 crossover works and 10/50, 14/50 and 12/60 also work, the result sits on a plateau and probably reflects something real. If it works and its neighbors don't, it's a spike, and a spike is what noise looks like. Fewer parameters, round values and a reason for each rule that you could explain before seeing the test all point the same way.
The experiment above is also a test you can run on your own process. Run your optimization on random or shuffled data. Whatever the best setting earns there is the size of the illusion your method can produce, and a real result has to clear it by a wide margin. Even then, live trading adds costs and fills a backtest doesn't model, which backtest vs live results goes through.
I'm sketching a tool that tests many combinations of entries, exits and sizing in the background, and this is the first problem it has to solve: the more hypotheses it mixes, the more convincing its best result will look by chance alone.
Educational content, not investment advice. Futures trading involves substantial risk of loss. Examples are for illustration only. Read the full Risk Disclosure.