Strategy Analyzer in NinjaTrader 8: Backtesting a Simple Rule Without Writing Code
Three windows and no code: the Strategy Builder for the rule, the Strategy Analyzer for the test, and a few settings in between that decide whether the fills are believable. A worked opening range breakout, the report lines worth reading, and what optimization does to a rule with no edge in it.
A year of five-minute NQ bars runs through the NinjaTrader 8 Strategy Analyzer in seconds, and the rule behind the test needs no code. Left at its defaults, the test also charges no commission, adds no slippage, and when one bar reaches both the stop and the target, it decides which came first from where the bar opened. This walkthrough builds a simple rule in the Strategy Builder, runs it with settings that make the result worth reading, and ends on the feature most likely to mislead: optimization.
The settings lean on the bar types and trading hours templates from the chart setup guide. The rule uses the 15-minute version of the range from the opening range post, and why every backtest flatters its rule is covered in backtest vs live results.
The rule
Long only, to keep the build short. On a five-minute chart of the cash session, take the high of 9:30 to 9:45 AM ET. Between 9:45 and 11:00 AM ET, the first five-minute close above that high buys one contract of the E-mini Nasdaq-100 (NQ) or the Micro (MNQ), with a 30-point stop and a 60-point target, one trade a day, flat by the close. Every number in that paragraph was picked rather than found, the 1:2 bracket included (the risk-reward post explains why), and that comes back in the optimization section.
Building it in the Strategy Builder
Open New › Strategy Builder from the Control Center. The wizard runs through eight screens: Welcome, General, Default Properties, Additional Data, Inputs and Variables, Conditions and Actions, Stops and Targets, and Finish.
- General. Name it, ORB15Long for example.
- Default Properties. Keep Calculate on On bar close and, under More properties, leave Exit on session close checked; the second one is the "flat by the close" part of the rule.
- Inputs and Variables. Add three variables, values the strategy sets while it runs: OrHigh and OrLow (double) and TradedToday (bool). Add StopTicks and TargetTicks as inputs if you plan to optimize them later, because only inputs can be optimized.
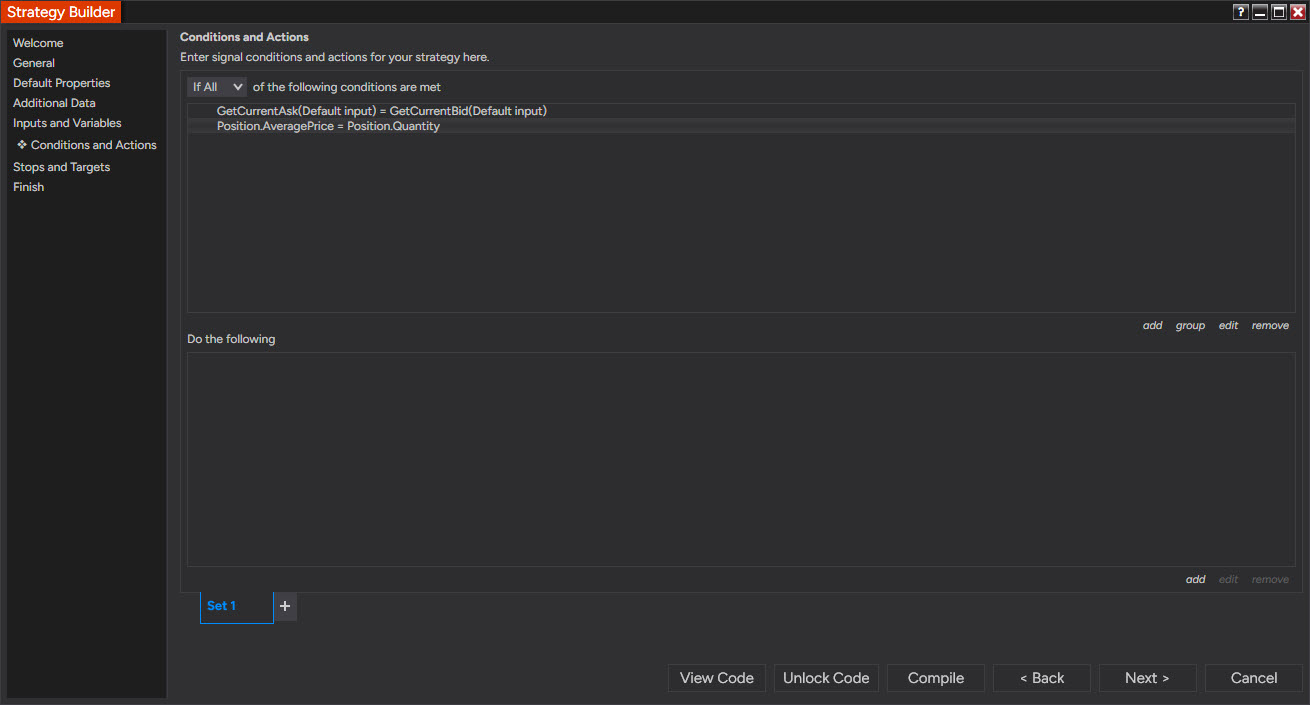
- Set 1, the range. Condition: Time series equals Time value 9:45 AM. Actions, all from Misc: Set OrHigh to MAX of High over 3 bars, Set OrLow to MIN of Low over 3 bars, Set TradedToday to False. Bars are stamped with their closing time, so the 9:45 bar is the last bar of the range, and the three bars ending at 9:35, 9:40 and 9:45 cover 9:30 to 9:45.
- Set 2, the entry. Conditions: Time series greater than 9:45 AM, Time series less than or equal to 11:00 AM, Close greater than OrHigh, TradedToday equals False. Actions: Enter long position from Order Management, then Set TradedToday to True from Misc, so a stopped-out trade doesn't buy again at the next close above the high.
- Stops and Targets. A stop loss of 120 ticks and a profit target of 240 ticks, which is 30 and 60 points because a tick on NQ and MNQ is 0.25 points. StopTicks and TargetTicks go here if you created them.
- Finish. Compile.
Times follow the time zone set under Tools › Settings › General (Options in older builds). On Central European time the rule needs 15:45 and 17:00, but only while both sides of the Atlantic are on the same daylight-saving setting; for three or four weeks a year, listed in the daylight saving post, those times land at 10:45 AM and 12:00 PM ET instead. A year-long test always crosses those weeks, so set the platform to Eastern time for the test and keep 9:45 and 11:00. The Unlock Code button opens the generated C# in the NinjaScript Editor, and an unlocked strategy can't go back to the Builder, so unlock a copy.
The settings that decide whether the result means anything
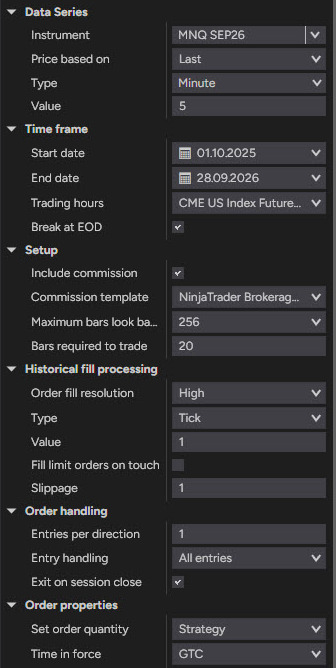
Open New › Strategy Analyzer, keep the Backtest type on Backtest, select the strategy and work down the settings panel. Most defaults can stay. These need setting or checking:
| Setting (group) | Set it to | Why |
|---|---|---|
| Instrument (Data Series) | The current contract, MNQ DEC26 | See merge policy below |
| Type and Value (Data Series) | Minute, 5 | The chart the rule was written for |
| Trading hours (Time frame) | The CME US Index Futures RTH template | The rule's times assume the cash session |
| Start date, End date (Time frame) | At least a year | About 250 sessions, so at most about 250 trades |
| Include commission, Commission template (Setup) | Checked, and a template at your rate | Costs come off every trade, at your rate rather than the default template's |
| Order fill resolution (Historical fill processing) | High, with the fill series set to Tick, 1 (it defaults to Minute, 1) | Settles the order of fills inside a bar |
| Fill limit orders on touch (Historical fill processing) | Unchecked (the default) | The target fills only when price trades through it |
| Slippage (Historical fill processing) | 1 | In ticks; applied to market, stop-market and MIT orders, never to limits |
Entries need nothing special. The rule decides as a bar closes and the test fills the order at the next bar's open, about what a live market order sent at that moment would get.
Commission comes from the template picked in the Commission template field under Setup; builds before 8.1.4 took it from the Sim101 account instead. Create one under Tools › Commissions with your all-in rate per side (about $0.90 to $0.95 on MNQ at a retail broker, about $0.50 on a Lucid account, going by the fees breakdown at the time of writing) and select it there.
Order fill resolution decides the order of fills inside a bar. Standard (Fastest) splits each bar into three legs and, when the open sits nearer the high than the low, assumes the high came first. On a volatile bar that spans both the stop and the target, that assumption alone decides between −30 and +60 points. High replays a finer series underneath, ideally one tick, and needs that history for the whole test period; one minute is the fallback if a year of ticks isn't available through your connection. It doesn't work with Tick Replay or with strategies that add their own data series, and every run gets slower.
Merge policy, the Global merge policy setting under Tools › Settings › Market data, decides what a year of MNQ DEC26 means. With Do not merge it's the December contract alone, a thinly traded back month until the September roll. Merge back adjusted stitches the earlier contracts together at their rollover dates and adjusts older prices by the gap at each roll, so the year is a year of the front month.
Reading the report
Press Run and the results open on the Summary display, with Analysis, Chart, Executions, Trades and Orders a click away.
Total # of trades is the first number to read. At one trade a day, a year holds about 250 at most, fewer on days without a breakout before 11:00, and below about 200 the win rate isn't known yet; the expectancy post shows how wide the error runs. Avg. trade is net of the commission and slippage you set. Divided by the point value, $2 on MNQ or $20 on NQ, it's the edge per trade in points, the number that has to survive the haircut from the backtest vs live post.
Profit factor is gross profit over gross loss. Max. drawdown is the deepest fall of closed-trade equity from a peak during the test; set it against the drawdown your account allows, which usually counts open trades too, and expect the live one to go deeper. Percent profitable and Ratio avg. win / avg. loss are the two halves of expectancy. With a 30/60 bracket the ratio should sit near 2, a little under once costs are in; trades closed at the session close pull it around, and the Trades display shows how many there were.
Then open the Chart display and check five trades against the rule by eye. An entry at 9:35, or a range built from the wrong bars, means the time zone or the trading hours template is off, and so is every number in the summary.
Optimization and a rule with no edge
Set the Backtest type to Optimization and each input gets a Min., Max. and Increment. The Default optimizer runs every combination, Genetic searches a subset, and the results come back sorted by the metric chosen under Optimize on, Max. net profit for example.
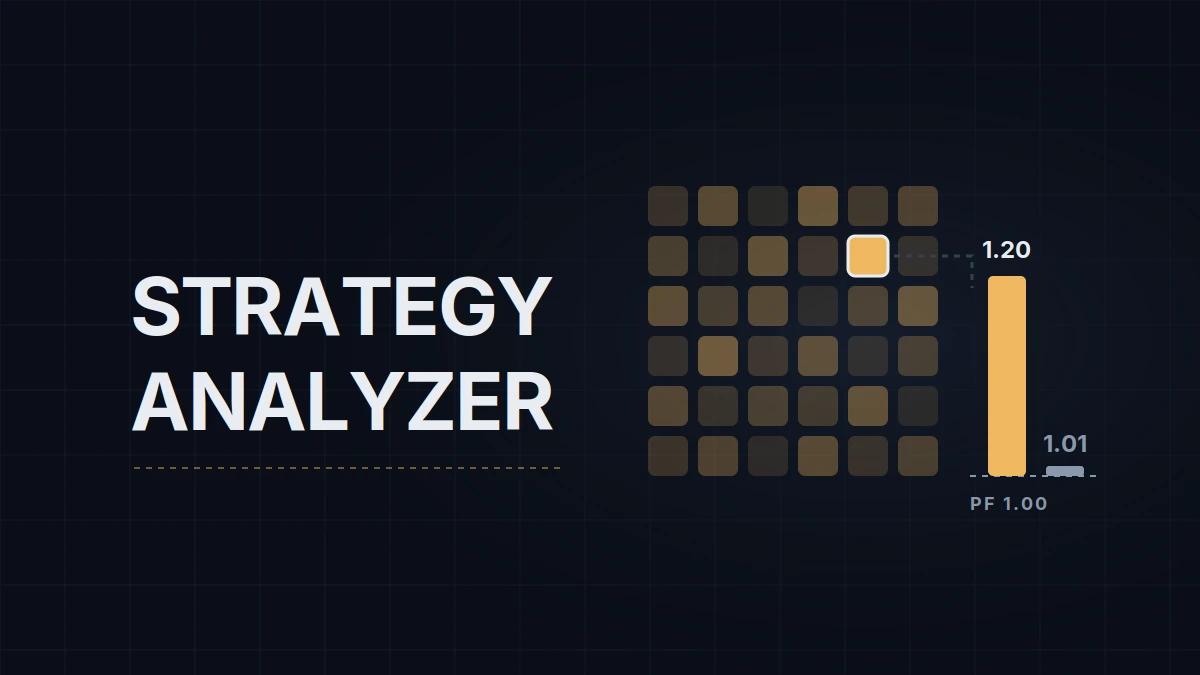
That makes it the fastest way to find settings that fit the past. To see how much of an optimized result can be luck, I ran this rule, long and short, on simulated sessions with no edge in them: random-walk prices with NQ-like volatility, where every combination of settings has an expected profit of exactly zero before costs. Eight stops from 15 to 50 points, eight targets from 20 to 120 points and five cut-off times from 10:15 AM to 12:00 PM ET made 320 combinations. In each of 200 simulated years of 250 sessions, the best combination was picked and then run on a fresh year:
| Best of 320, in the year it was picked from | Same settings, the following year | |
|---|---|---|
| Median profit factor | 1.20 | 1.01 |
| Profit factor, one year in ten | 1.37 or higher | 1.20 or higher |
| Median net result | +1,043 points | +46 points |
| Years that made money | 96% | 53% |
On one MNQ contract, +1,043 points is about $2,100 for the year. None of the 320 combinations had an edge; the optimizer found the one that fit its own year's noise best, and the following year was a coin flip. On a real rule the same selection effect sits on top of whatever edge there is, and the report can't separate the two.
What helps:
- Fix the ranges before the first run, with few inputs and wide steps. Every extra input multiplies the combinations, and the best of more combinations is luckier.
- Look for a plateau, not a peak. If 30/60 works while 25/50 and 35/70 fall apart, the 30/60 result is noise.
- Run Walk Forward Optimization from the same Backtest type list. It optimizes on one stretch of data, the Optimization period (days), tests the winner on the next, the Test period (days), and rolls forward; the test rows are the ones that count.
- Keep the latest months out of every run and test on them once, at the end.
My own use of backtests is narrower than this example: calibrating exits, the trailing stop distance above all, from test and excursion data rather than from how a number feels.
Educational content, not investment advice. Futures trading involves substantial risk of loss. Examples are for illustration only. Read the full Risk Disclosure.