Losing Streaks on a Prop Account: How Long a Normal Streak Is and What It Does to Your Drawdown
Losing streaks are longer than they feel like they should be. Exact odds of the longest streak in 100 and 250 trades at win rates of 40, 50 and 60%, the chance that a streak alone reaches the floor of a 25K or 50K account, and the ways traders size for it.
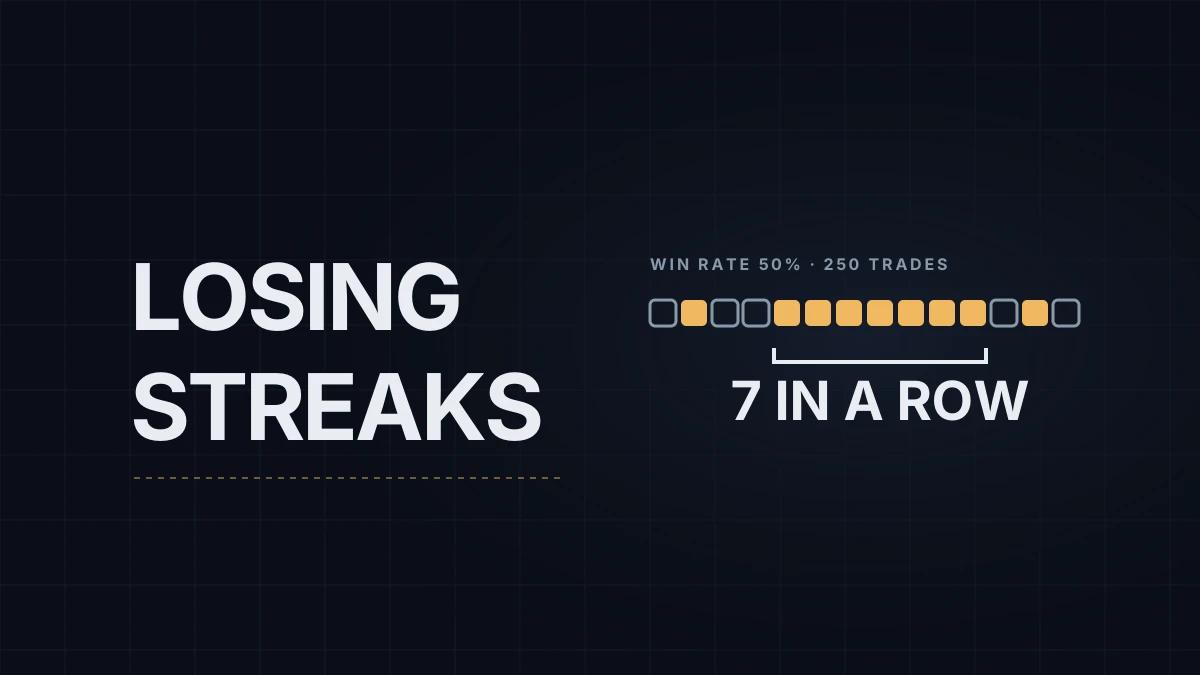
A trader who wins exactly half the time will, over 250 trades, have a run of at least 7 losses in a row 63% of the time, and a run of 10 or more about one time in nine. Nothing is wrong when that happens. Those are the odds of independent trades with a coin-flip win rate, and a prop account with a trailing drawdown has to be sized to live through them.
The numbers below are exact probabilities for independent trades at a fixed win rate, not a simulation of anyone's results. Real trades aren't perfectly independent, since losses cluster on choppy days and after tilt, which makes real streaks, if anything, a little longer. How the account itself works is in prop firm evaluations explained.
How long the longest streak gets
The longest losing streak in a run of trades, by win rate. "Median" is the streak length you'd see in a typical run; the 95th percentile is the length that no more than 1 run in 20 exceeds.
| Win rate | 100 trades: median | 90th percentile | 95th percentile | 250 trades: median | 90th percentile | 95th percentile |
|---|---|---|---|---|---|---|
| 40% | 7 | 11 | 12 | 9 | 13 | 14 |
| 50% | 6 | 8 | 9 | 7 | 10 | 11 |
| 60% | 4 | 6 | 7 | 5 | 7 | 8 |
Two patterns are worth noticing. Going from 100 to 250 trades adds only one or two losses to the typical streak, because the longest run grows with the logarithm of the number of trades, not in proportion. And a lower win rate stretches streaks fast: a trend-following style that wins 40% of the time with large winners should expect a streak of 9 in an ordinary stretch of 250 trades.
When a streak alone reaches the floor
On a drawdown of $2,000, a fixed risk of $200 per trade means ten consecutive full losses touch the floor, and touching it ends the account. Here's the chance that a run of 250 trades contains at least one streak long enough to do that by itself:
| Full losses that reach the floor | Example | Win rate 40% | 50% | 60% |
|---|---|---|---|---|
| 4 | $1,000 drawdown, $250 per trade | over 99.9% | over 99.9% | 98% |
| 5 | $1,000 drawdown, $200 per trade | over 99.9% | 99% | 79% |
| 8 | $2,000 drawdown, $250 per trade | 83% | 38% | 9% |
| 10 | $2,000 drawdown, $200 per trade | 45% | 11% | 2% |
| 20 | $2,000 drawdown, $100 per trade | under 1% | under 1% | under 1% |
A $1,000 drawdown is typical of a 25K evaluation and $2,000 of a 50K at the time of writing (Apex Trader Funding, Lucid and Topstep's 50K all use $2,000). At $200 a trade, a 25K account is one ordinary streak away from the floor at almost any win rate. The comparison by account size is in choosing an evaluation size.
This table is the floor of the risk, not the whole of it. It counts only unbroken streaks starting with the full drawdown available. Losses interleaved with a few wins drain the room too, and on a trailing account every new high pulls the floor up behind it. In a simple simulation of 20,000 runs with a 50% win rate, wins 1.5 times the size of losses and $200 risked on a $2,000 trailing drawdown, the floor was touched somewhere in 250 trades in about 48% of runs, more than four times the 11% from streaks alone, even though every trade had a positive expectancy. Trading expectancy and risk of ruin covers why a positive edge doesn't protect an account sized too large.
Sizing for the streak
- Size from the 95th percentile. Divide the room by the 95th percentile streak for your win rate, plus a margin. At 50% and 250 trades that's 11 losses, so a $2,000 drawdown supports roughly $165 of risk per trade before costs ($2,000 ÷ 12). That covers the streak, not the whole risk: in the same simulation as above, $165 a trade still reaches the trailing floor in about 1 run in 4, and $100 a trade in under 2%. The cost of sizing down is a slower climb to the target.
- Cut size after a run of losses. Halving size after, say, three losses in a row slows the drain during a streak. The cost is a slower recovery once it ends, since the first winners come at half size.
- Use a daily loss limit. It caps how much of a streak can happen in one session, which matters because streaks often arrive in one bad session. It doesn't stop a streak that spreads over several days. NinjaTrader's own version is set up in the NinjaTrader daily loss limit.
- Know your real win rate first. All of this depends on a win rate measured over enough trades to mean something; how many trades before you judge a setup covers how wide the uncertainty is on a small sample.
Educational content, not investment advice. Futures trading involves substantial risk of loss. Examples are for illustration only. Read the full Risk Disclosure.