NQ Fell 7% and Never Halted: The November 5, 2026 Chip Crash Explained
The chip index had its worst day since March 2020, the Nasdaq-100 closed down 6.4%, and NQ traded through its own 7% level after the stock market closed. What drove the selloff, why no limit triggered, and what a 1,900-point range does to position size.
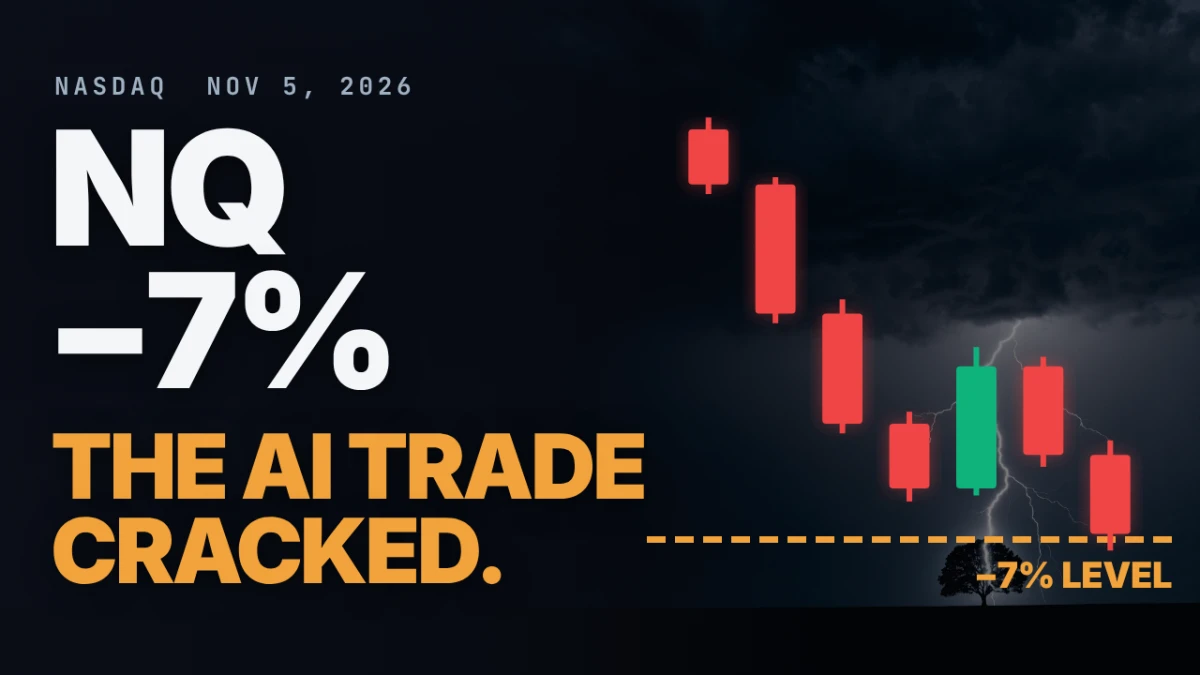
NQ futures (the E-mini Nasdaq-100 contract) fell to 26,571.75 on Thursday, November 5, 2026: 1,995 points, or 7.0%, below Wednesday's settlement of 28,566.75. That price sits 4.5 points under 26,576.25, where CME's 7% downside limit stood in the morning. Trading never stopped, because by the time NQ got there, that limit was no longer in force.
The day in numbers
| Market | Thursday, November 5 | Note |
|---|---|---|
| NQ (Dec), session low | 26,571.75 (−7.0%) | after the 4:00 PM ET stock close |
| NQ, first low | 26,735 (−6.4%) | around 11:00 AM ET |
| Nasdaq-100, close | −6.4% | worst day since March 2020 |
| S&P 500, close | −4.4% | worst day since April 2025 |
| PHLX Semiconductor Index (SOX), close | −12% | worst day since March 2020 |
| ES (Dec), session low | about 7,345 (−4.9%) | E-mini S&P 500 |
| VIX | 28.2 at the close, from 16.6 (high 28.4) | highest since March |
| SOXL, 3x daily chip ETF | −33.7% at 3:46 PM ET | −73% over one month |
NQ and ES percentages are measured from the CME reference prices (28,566.75 and 7,720.50). Index closes come from Yahoo Finance and NBC News, the NQ and ES lows from my NinjaTrader 8 charts.
How the session unfolded
The first cracks showed overnight in Asia: Korea's KOSPI fell 5.3% and SK Hynix, one of the largest memory makers, lost 9.5%. Before the US open Qualcomm was down about 10% on weak phone-chip revenue and Bloomberg reported that Micron had paused a $4.5 billion fab in Taiwan, yet NQ was only about 1% lower and Dow futures were green.
The cash open at 9:30 AM ET (15:30 CET) changed that. The Nasdaq Composite erased its entire post-election rally in six minutes, stood about 4% lower by 10:30 and more than 5% lower by late morning. NQ printed its first low at 26,735 around 11:00 AM ET, roughly 1,700 points under the overnight high. A bounce of about 600 points followed, and it was sold. In the afternoon the selling spread to banks and industrials: Goldman Sachs −6.3%, Morgan Stanley −5.7%, Caterpillar −6.1% around 3:45 PM ET.
Late in the session S&P futures made a new low and NQ took out 26,735. After the stock market closed, the slide carried on through the last hour of futures trading, down to 26,571.75.
Why NQ did not go limit down
CME price limits on equity index futures run on a clock. Times are US Eastern, with Central European Time in brackets.
| Window | Downside limit on NQ | Thursday's level |
|---|---|---|
| 9:30 AM to 3:25 PM ET (15:30 to 21:25 CET) | reference price minus 7%, 13% and 20% of the Nasdaq-100 close | 26,576.25 / 24,870.00 / 22,879.50 |
| 3:25 to 4:00 PM ET (21:25 to 22:00 CET) | 20% only | 22,879.50 |
| 4:00 to 5:00 PM ET (22:00 to 23:00 CET) | 7% around the 4:00 PM fixing price, never past the day's 20% limit | far below the market |
| 6:00 PM ET to the next 9:30 AM open | 7% up and down around the 4:00 PM fixing price | far below the market |
Inside the first window, a contract offered at the 7% limit can trade at that price or above, but not below. If it is still pinned there after two minutes, trading halts for two minutes and the limit widens to 13%. NQ never reached 26,576.25 during that window: its first low held 159 points above it. When it finally traded through the level, after 4:00 PM, the only limits in force were far lower. (The fixing price is CME's volume-weighted average of the last 30 seconds before 4:00 PM ET. The reference price for Thursday's limits was Wednesday's fixing, 28,566.75, and the steps are percentages of Wednesday's Nasdaq-100 close, 28,437.17, rather than of that price, which is why the 7% limit sat 1,990.50 points below it. The NQ price limits post covers the whole mechanism.)
The stock market has separate circuit breakers, tied to the S&P 500 rather than the Nasdaq. A 7% or 13% drop before 3:25 PM ET halts all US stocks for 15 minutes, and CME halts the index futures with them; a 20% drop closes both for the rest of the day. The S&P 500 closed down 4.4%, nowhere near level 1. Market-wide halts have hit on just one day in October 1997, under the old Dow-point rules, and on four days in March 2020.
What drove the selloff
Three things stacked on top of each other.
The vote. In Tuesday's midterms, 41 local ballot measures on data centers in 10 states went against new projects in every case but one, a small town in North Dakota (CNBC). In Texas the governor-elect has promised a moratorium. UBS estimates about 30% of the US data center capacity expected to come online in 2028 is now at risk of delay, 18 gigawatts in Texas alone, and Goldman Sachs says the states likely to restrict data centers hold about 45% of planned US capacity, Texas roughly a quarter on its own. Chip stocks are priced on orders a year or two out, so a slipping construction timeline reprices them today. UBS frames it as a delay rather than a cancellation.
The AI bill. The week before, Alphabet had its worst day on record after a second straight quarter of negative free cash flow (cash from operations minus spending on buildings and equipment), Intel fell 28.6% on a weak forecast, and Amazon reported trailing twelve-month free cash flow of minus $42.4 billion while planning about $220 billion of capital spending. Thursday added Qualcomm, whose phone-chip revenue fell 26%, partly because AI servers absorb so much memory that memory prices have jumped.
Rates. The Fed held at 3.75% to 4% on October 28 with two votes for a hike, futures still price roughly a 60% chance of a December hike, down from about 80% before the selloff, and the Bank of England raised its rate on Thursday. A dollar of profit ten years out is worth about 68 cents today at a 4% discount rate and about 61 cents at 5%, so one point on the rate takes roughly 9% off its value; twenty years out, about 17%. Growth stocks carry most of their value far out, which is why tech takes the hit first.
Size explains why it spread to everything else. Nvidia alone is worth more than $4 trillion, and at their peak this summer chipmakers made up close to a fifth of the S&P 500. When volatility jumps, funds that size positions by volatility cut exposure across the board, and when someone sells index futures to hedge, arbitrage traders sell the whole basket of stocks behind them.
What a day like this does to position size
Last Friday, NQ options priced a one-standard-deviation day at about 500 points (from a VXN, the Nasdaq-100 volatility index, of 28.5). That is a close-to-close figure; the high-to-low range of an ordinary day runs about 1.6 times it, so roughly 800 points. Thursday's range was close to 1,900 points, more than twice that, and the drop from Wednesday's settlement to the low came to almost four standard deviations. On one MNQ contract (Micro E-mini Nasdaq-100) at $2 a point, 1,900 points is $3,800; on a typical 50K prop evaluation the maximum loss is around $2,000 at the time of writing. A stop sized for a normal day gets taken out by noise, and a stop widened to survive the noise multiplies the dollar risk. Keeping the dollar risk constant means cutting size in proportion to the range, which on a day like this rounds down to one micro contract or to none. The NQ volatility post shows how to turn the VXN into an expected range before the open.
Daily 3x funds show the same problem from another angle. SOXL rebalances every day, so an index that drops 10% and then gains 10% ends down 1%, while the 3x fund ends down 9%. In a choppy, falling market that drag compounds, and the rebalance near the close adds selling into the last hour.
The other side, and what comes next
A one-day crash is not a forecast. Since 1985, about two in three Nasdaq Composite corrections stopped short of a bear market, with a median return near 24% over the following twelve months (Trefis). After each of the last 11 midterm elections, the S&P 500 was higher a year later. Last December UBS said the global data center equipment market showed no sign of cooling, with 25 gigawatts under construction. None of that tells you what Friday does.
The next tests are the October jobs report on Friday, November 6 at 8:30 AM ET (14:30 CET), one of two before the December 9 Fed decision, October CPI on Tuesday, November 10 at 8:30 AM ET, and Nvidia's third-quarter results on Tuesday, November 17 after the close. The jobs report and Nvidia's date are already on the calendar (CPI joins them with next week's schedule), and the economic releases post ranks how much each one usually moves NQ.
Educational content, not investment advice. Futures trading involves substantial risk of loss. Examples are for illustration only. Read the full Risk Disclosure.
Read next
NQ Week Ahead (Nov 2–6, 2026): Midterms, Apple, AMD, Payrolls and the 10% Line
Intel's worst day since 1974 pushed NQ through the 10% correction line before it settled at 28,534. Now the clocks are six hours apart again, election results arrive overnight on Globex, Apple, AMD and Qualcomm report on three straight evenings, and payrolls close the week.
NQ Week Ahead (Oct 26–30, 2026): Fed, Big Tech Earnings, PCE and the Lost 2026 POC
NQ lost 865 points on Thursday and closed the week at 29,117.75. The levels around the 2026 POC and Friday's low, plus a 19-hour window with the Fed, Microsoft, Alphabet, GDP, PCE and the ECB, every time in ET and CET.
NQ Week Ahead (Oct 19–23, 2026): Meta, Tesla, Netflix and the September Floor
The VXN priced a 900-point week; NQ fell 1,717 points and made a lower low every day. CPI and PPI ran hot, but the selling that didn't stop came from AI credit and chip stocks. Now almost 9% of the Nasdaq-100 reports in one Wednesday evening, with the Fed in its quiet period.