Market Profile Shapes on NQ: P, b, D and Double-Distribution Days
Two sessions with the same high, low and close can leave very different Market Profiles. What the P, b, D and double-distribution shapes record, why a P is not proof of short covering, how a D differs from Dalton's normal day, and how session window and row size reshape the picture.
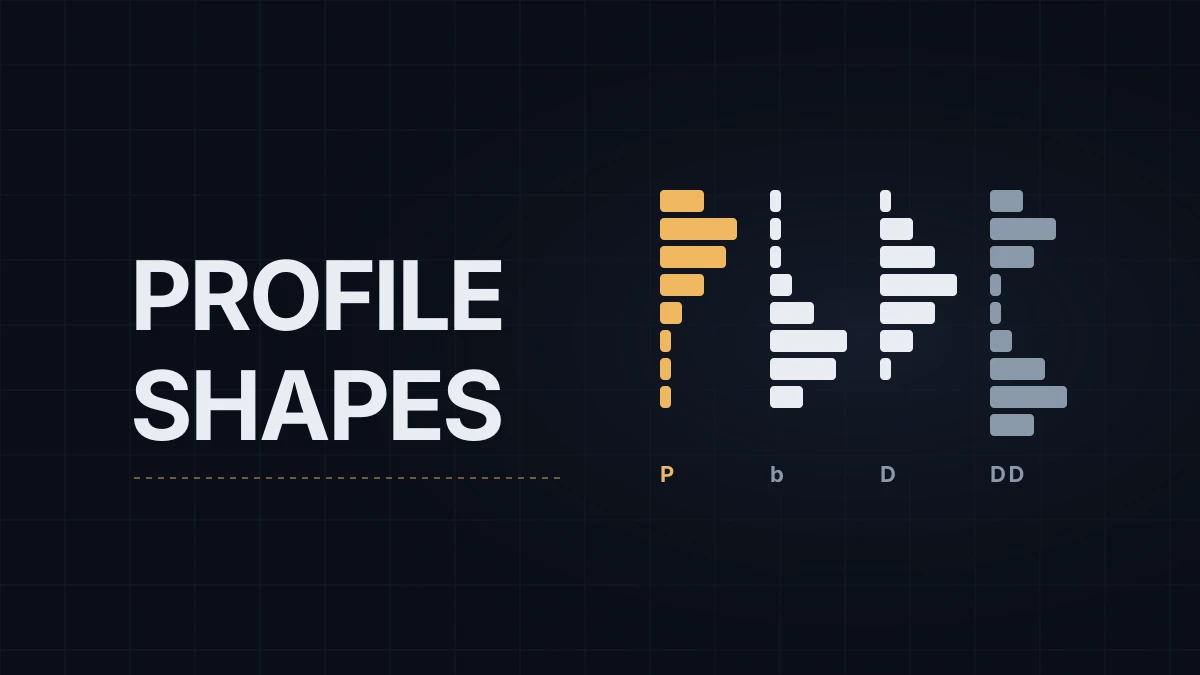
Two NQ sessions can share the same high, the same low and almost the same close and still leave very different Market Profiles. One climbs quickly off its low and spends the afternoon stacked near the top; the other builds a single round bulge in the middle of its range. Market Profile traders give those outlines names, P, b, D and double distribution, because the shape records where the session found two-way trade and where it only passed through.
The shapes come from the letter-based TPO chart explained in Market Profile (TPO) on NQ. The examples use NQ, the E-mini Nasdaq-100 future; tick and point value covers the contract itself.
 P              b              D              Double distribution
 xxxx           x              x              xxx
 xxxxxxx        x              xxx            xxxxxx
 xxxxxx         x              xxxxx          xxxx
 xxxx           xx             xxxxxxx        x
 xx             xxxx           xxxxx          x
 x              xxxxxxx        xxx            xx
 x              xxxxxx         x              xxxxx
 x              xxx                           xxxxxxx
                                              xxxx
Each row is a price, each x one 30-minute period that traded there. Higher prices at the top.
P and b: one-sided sessions
A P-shaped profile has a thin lower stem and a fat upper bulge. The usual story behind it is short covering: the session opens near its low, the first periods drive up fast and leave single prints underneath, and the rest of the day rotates in a narrower range near the top. The b shape is the mirror image, a fat bottom under a thin top, and its usual story is long liquidation: an open near the high, a fast drop, then rotation near the low.
Those labels name a likely cause, not a confirmed one. In Mind Over Markets, Dalton cautions that a profile taking on a P or b shape doesn't by itself mean covering or liquidation is happening; where the session opened and what followed the first drive matter as much. The reading gets stronger when three things line up:
- The session follows one or more days in the opposite direction: down days before a P, up days before a b.
- The open sits near the extreme the move starts from, the low for a P and the high for a b.
- The move stalls after the first drive, and the rest of the day rotates instead of extending.
The difference shows up in the next session. Short covering is traders closing old positions, and once it's done the buying can dry up, letting price drift back toward the stem. A P built by new buyers who keep their positions tends to be followed by value forming higher again. On the day the shape forms, the shape alone can't tell the two apart; the three checks above make one reading more likely, and the next session's value tends to settle it.
D: balance
A D-shaped profile is a single bell, thick in the middle around the point of control (POC), the price with the most TPOs, and thinning toward both ends. Buyers and sellers traded the whole range and agreed on value somewhere near its center. Many range days end up looking like this, and after a D both edges of its value area are the obvious references for the next morning.
A D is a picture, while Dalton's day types are definitions. His types are built on the initial balance (IB), the range of the first hour, and on whether the session extended beyond it. A normal day sets a wide IB and does little or nothing outside it; a neutral day extends on both sides of the IB, and one that closes in the middle is called neutral-center; a nontrend day stays narrow throughout. All three can finish as a D. Trend day vs range day on NQ covers how to read the session type while it unfolds; the shape is the after-the-fact record.
Double distribution: two balances in one session
A double-distribution profile has two separate bulges with a run of single prints between them. The session typically starts with a narrow first hour while traders with a longer horizon stay out. Later they arrive, push price through one edge, and the market builds a second area of value at the new level. Dalton counts it among his six day types as the double-distribution trend day, the second of his two kinds of trend day, and of all the shapes it shows value moving within a single session most clearly.
The single prints between the two areas are what later sessions test. If price comes back and builds letters there, filling the gap in, the market is accepting prices it skipped and the move that created the gap is losing force. Poor highs and single prints covers how those rows are read.
Where shapes get misread
A P is not a trend day. A trend day up keeps extending into the close and finishes near its high, with a profile that stays long and thin, usually no more than four or five letters wide at any point. A P extends early and then stops; the fat top is the market finding balance after the move, not more of the move.
The session window changes the shape. A profile limited to regular trading hours (RTH, 9:30 AM to 4:00 PM ET, 15:30 to 22:00 in Central Europe in a normal week and 14:30 to 21:00 from October 26 to 30, 2026) and a profile of the full Globex session describe different days. An overnight drop followed by a recovery during US hours can look like a P on the RTH profile and much rounder on the full session, where the overnight trade fills in the lower stem.
Row size changes it too. Larger rows smooth a profile into a cleaner outline; one-tick rows break it into steps. Shapes are only comparable from day to day at the same row size and on the same session.
Each session in my journal gets a day-type tag, which makes it easy to look back at what the next morning did after a P, a b or a D.
Educational content, not investment advice. Futures trading involves substantial risk of loss. Examples are for illustration only. Read the full Risk Disclosure.