Trend Day or Range Day: Early Signs on NQ Before 10:30 AM ET
A trend day and a range day reward opposite trades, and the call gets made before 10:30 AM ET. What the overnight range, the open, dealer gamma, the first pullback, first-hour volume, VWAP and the IB's width each say, when each one is known, and what they're worth added together.
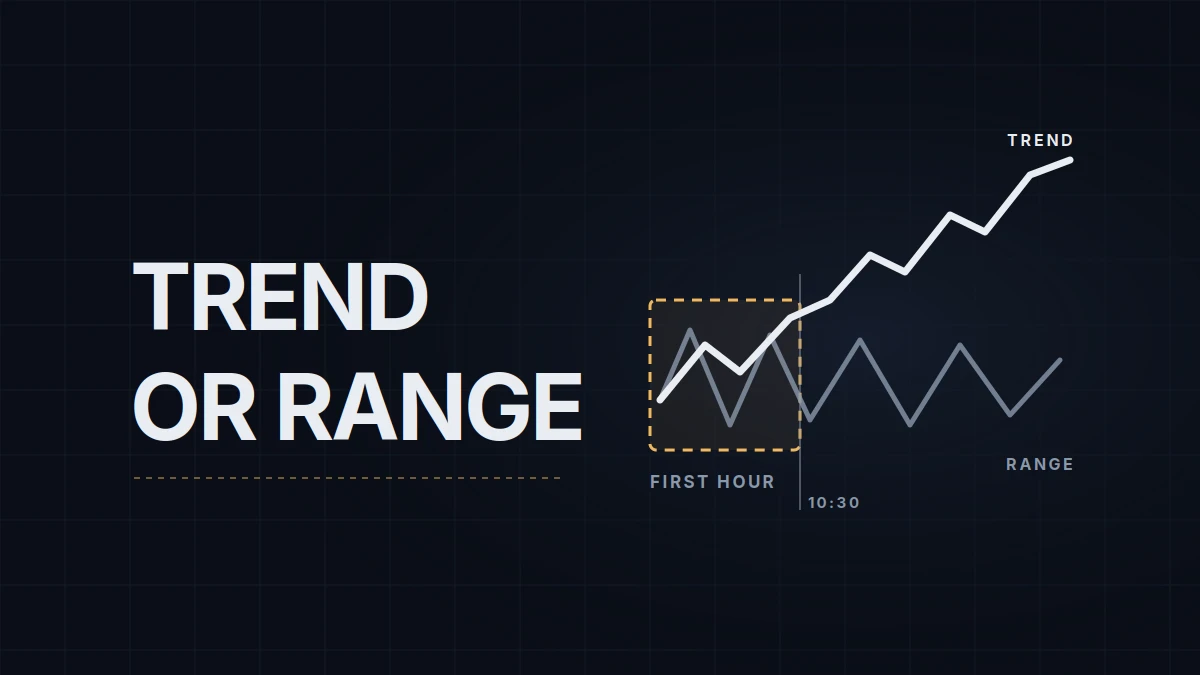
Whether a day on NQ trended or rotated is settled at the 4:00 PM ET (22:00 CEST) close. Most of the decisions that depend on it are made before 10:30 AM ET (16:30 CEST): whether to fade the first push away from the open, how much room a stop needs, whether to hold a winner past the first level. Trend day vs range day is a call traders make early and on partial evidence, so the useful skill is knowing which evidence arrives when and how much each piece is worth.
The finished-chart version of the two days, swing by swing, is in market structure: trend vs range. NQ is the E-mini Nasdaq-100 future, and MNQ its micro; their tick and point values are in the contract basics. What follows is the early read, before the chart is finished.
Two days that pay opposite trades
A trend day leaves the opening area within the first hour and doesn't come back: pullbacks are shallow, each extension goes the same way, and the close sits near one extreme of the day. A range day rotates. Its first hour holds a large part of the day's range, breaks of the edges fail or crawl, and the close lands somewhere in the middle. James Dalton's Mind Over Markets sorts sessions into finer types (normal, normal variation, trend, double-distribution trend, neutral, non-trend) by how far price extends beyond the first hour, the initial balance or IB, and whether it does so on one side or both. The two ends of that scale are the ones that change trading decisions.
They change them in opposite directions. A short at the top of the first hour's range is the trade of the day on a range day and a string of stopped-out attempts on a trend day, while the breakout buyer who does well on the trend day gets chopped at every edge of the range day. Breaking the IB proves little by itself: in the TradingStats study quoted in the initial balance post, 96.2% of NQ sessions from 2015 to 2025 broke at least one side of the first hour by the close. What separates the two days is how far the break goes and whether price is accepted out there.
Before the open
Three pieces of evidence exist before the cash open at 9:30 AM ET (15:30 CEST).
The first is the overnight range measured against the average daily range. A narrow night leaves most of the day's range to be built after 9:30, which is the raw material a trend day needs, though it says nothing about direction. A wide night with the open back near its midpoint hands the day two obvious edges to rotate between. The overnight session post has rough width bands, and what the cash session did with the overnight high and low from 2015 to 2025.
The second is where the open sits against the prior day. An open outside the prior day's range that holds its first test marks a trend-day candidate; an open inside it, with nothing new to price, is the usual start of a rotation. Whether a gap holds or closes is its own question, covered in gap fills on NQ.
The third comes from the options market. When dealers are net short gamma, the hedging they do to stay flat adds to moves: they buy as price rises and sell as it falls. When they're long gamma, they hedge the other way and lean against moves, and price tends to stick near large strikes. Gamma exposure explains the regime, and gamma levels covers where to read it each morning.
The calendar can override all three. A release at 8:30 AM ET (14:30 CEST) can erase the overnight read in a minute, and one at 10:00 AM ET (16:00 CEST) lands in the middle of the first hour and can reset the IB itself. The economic calendar shows which days carry one.
The first hour, 9:30 to 10:30 AM ET
The open is the next clue. A market that drives away from the opening price and never trades back to it is showing the strongest early sign of a trend day there is. One that auctions back and forth through the opening price for the first half hour usually keeps doing that.
Then comes the first pullback. On a trend day it's shallow, holds above the midpoint of the first push and gets bought before the push's high is retested. On a range day it retraces the whole push and more.
Participation says whether anyone came: volume in the first hour compared with the same hour on recent days, never with the day as a whole. Heavy volume with price holding its gains means the move found business; light volume means it hasn't yet. VWAP tells a similar story from another angle. A line that slopes steadily with price staying on one side of it is trend behavior, and a flat line crossed again and again is rotation.
By 10:30 the IB is complete and its width is a number. Measured against the daily ATR, the average true range of recent sessions, a narrow IB leaves most of the day's range still to come, and an IB close to a full ATR has probably used much of it up.
| Signal | Known by (ET) | Leans trend day | Leans range day |
|---|---|---|---|
| Overnight range vs average daily range | 9:30 | Narrow night, most of the day's range still to build | Wide night, open back near its midpoint |
| Open vs prior day's range | 9:30 | Outside, first test holds | Inside, nothing new to price |
| Dealer gamma regime | Before the open | Negative gamma | Positive gamma, large strikes nearby |
| Open type | 9:45 to 10:00 | Drive away from the open, no return | Rotation through the opening price |
| First pullback | About 10:00 | Shallow, holds above the push's midpoint | Retraces the whole push |
| First-hour volume vs recent first hours | 10:30 | Above average, one-sided | Average or below |
| VWAP | 10:00 to 10:30 | Sloping, price on one side | Flat, crossed repeatedly |
| IB width vs daily ATR | 10:30 | Small fraction of the ATR | Close to a full ATR |
Adding it up
The rows aren't independent votes. A gap and a narrow night often arrive together, and negative gamma and a hard drive from the open feed each other, so three agreeing rows can be one piece of evidence counted three times. Two readings from different parts of the table, one from before the open and one from the first hour, carry more weight than three from the same part.
Days that travel far from the first hour are the minority on NQ: in the same TradingStats study, price reached a full IB width beyond the high by the close on 12.8% of sessions and beyond the low on 15.9%, and about a third of first breaks ended the day back inside the IB. That makes trend the call that needs agreement, not the default. Where the bar sits depends on the trade. For a trader who fades edges, the trend day is the expensive mistake, so one strong trend signal is enough to stop fading. For a trader who buys breakouts, the range day is the expensive one, and the same signal is only a reason to start watching.
Nothing is final at 10:30. The first extension beyond the IB and the depth of the pullback that follows it settle much of what's left, and the initial balance post has numbers on both.
For European readers the clock times shift for one week this autumn. Between the European clock change on October 25 and the US change on November 1, 2026, the first hour runs from 14:30 to 15:30 CET instead of 15:30 to 16:30; the daylight saving schedule has the details.
Most of my own trading happens in the European session, 9:00 to 15:30 CEST, which ends as the first hour begins. The gamma row is the one I read before I trade, and it has the most say in my plan: on a negative-gamma day, the size comes down or the setup waits. The rest of the table mostly becomes notes for the next morning's levels.
Educational content, not investment advice. Futures trading involves substantial risk of loss. Examples are for illustration only. Read the full Risk Disclosure.