Stop Placement on NQ: Behind the Level, ATR-Based, Structure-Based and Time-Based
The same long on NQ with the stop behind the level, at 1.5 ATR, below the last swing low, or on a clock. Where each one goes, what it costs in contracts and in reward-to-risk, which trades it loses, and how traders combine two of them into one rule.
Long NQ at 29,428.00 after a pullback to yesterday's high. One trader puts the stop at 29,411.00, 17 points away. A second puts it at 29,395.00, 33 points away, and a third at 29,388.00, 40 points away. A fourth sets no price at all, only a clock: out at market if the trade hasn't worked in 30 minutes. All four are standard stop loss placement methods in futures, and they turn one entry into four different trades.
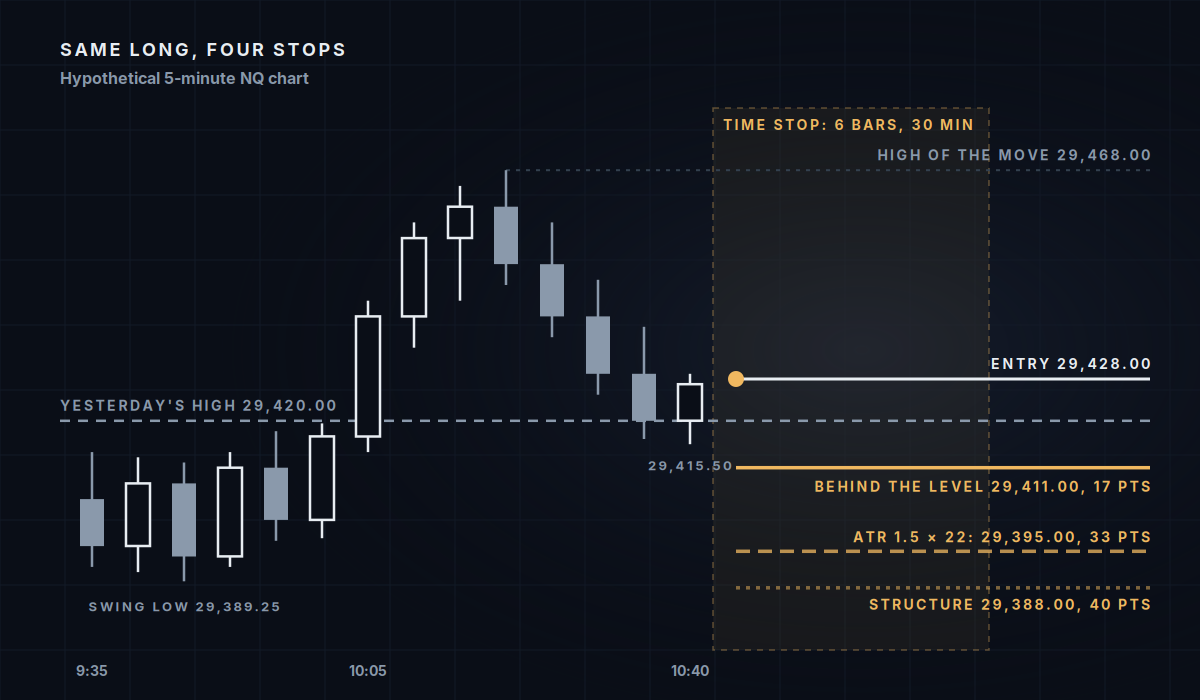
The prices are hypothetical, on a 5-minute chart of NQ, the E-mini Nasdaq-100 future. A point on NQ is worth $20, and on the micro, MNQ, $2 (tick and point values). The setup: yesterday's high at 29,420.00 broke at 10:05 AM ET / 16:05 CEST, price ran to 29,468.00, and the pullback came back through the old high to 29,415.50 before a bar closed back above it at 29,427.00. The last swing low before the breakout sits at 29,389.25. The 5-minute ATR(14), the average true range of the last 14 bars, reads 22 points.
Behind the level
The trade exists because yesterday's high is expected to hold as support. The idea is wrong once price is accepted back below it, so the stop goes beyond the level plus room for the probing that levels get: here 4.5 points below the pullback's low and 9 points below the level, at 29,411.00. Reversal trades at key levels works through the same order of thinking, invalidation first and the stop second.
It's the tightest of the three price stops, and it buys the most contracts for a fixed risk. The cost is exposure to probes. A pullback that runs 5 points deeper, to 29,410.50, takes this stop and leaves the next two alive, and probes that run a few points through an obvious level are routine on NQ; liquidity sweeps covers why stops parked just beyond a level get hit. The level stop is also only as good as the level. On a chart with no clear reference price, it has nothing to stand behind.
ATR-based
The ATR stop ignores the chart and measures the noise instead. A common setting is 1.5 to 2 times the ATR of the entry timeframe; at 1.5 × 22 points the stop sits 33 points below entry, at 29,395.00. The average daily range post covers how ATR is computed and why it lags.
Its strength is consistency. Measured in units of current volatility, the stop is the same size on a quiet afternoon and a busy open, so results stay comparable across regimes. Its weakness is that the price it produces means nothing on the chart. 29,395.00 is below the level and above the swing low, in a place where the trade's idea was already dead 16 points earlier and no structure is protected. And because ATR is an average of past bars, it registers a jump in volatility late: the first bars of a spike are measured against the calm before them.
Structure-based
A structure stop goes beyond the last swing low, the point whose loss would turn higher lows into a lower low, here 29,389.25 on the 5-minute chart. With a little over a point of room it lands at 29,388.00, 40 points below entry. The pullback low at 29,415.50 doesn't count yet, because a swing low is only confirmed once price has moved away from it, and at the entry it hasn't. Market structure covers how swings are read.
The structure stop survives almost any probe of the level; it's hit only if the uptrend itself breaks. Its distance comes from the chart's geometry, though, and nothing makes that fit the trade. The high of the move at 29,468.00, the first place the trade is likely to slow, is also 40 points away: a reward-to-risk of 1.0 before costs, which needs a win rate above 50% just to break even (the risk-reward post has the arithmetic). It also depends on the chart. A swing low on a 5-minute chart may not be one on a Range 30 chart.
Time-based
A time stop exits a trade that hasn't worked within a set number of bars or minutes, whatever the price. Here: if price hasn't traded 29,445.00, one risk unit above entry measured with the level stop, within six 5-minute bars, the position closes at market.
It rests on something traders who fade levels see often: a level that's going to hold usually shows it quickly, and price that sits at a level for long is testing it rather than being pushed away from it. The time stop caps what those slow trades cost, since most of them exit near the entry instead of at the full stop. What it gives up is the winners that needed more than 30 minutes, and there will be some. A time stop never replaces a price stop, because a clock does nothing about a 40-point drop inside the six bars; here the hard stop stays at 29,411.00. On range or tick charts six bars isn't a fixed length of time (bar types explained), so a time stop there is better written in minutes.
The four side by side
For a trader risking $200 per trade on MNQ, the stop decides the size before anything else does:
| Method | Stop | Points | Risk per MNQ | MNQ contracts for $200 | Room to 29,468.00 ÷ risk |
|---|---|---|---|---|---|
| Behind the level | 29,411.00 | 17 | $34 | 5 ($170) | 2.4 |
| ATR, 1.5 × 22 | 29,395.00 | 33 | $66 | 3 ($198) | 1.2 |
| Structure | 29,388.00 | 40 | $80 | 2 ($160) | 1.0 |
| Time, 6 bars | Clock, hard stop 29,411.00 | 17 at most | $34 at most | 5 ($170 at most) | 2.4 |
On NQ the dollar figures are ten times larger: the level stop costs $340 a contract and the structure stop $800.
The table shows the usual trade-off. The tighter the stop, the more contracts, the better the reward-to-risk on paper, and the more often ordinary noise ends the trade. The wider the stop, the fewer the stop-outs, and the less the trade can make relative to what it risks. Position sizing covers turning any of them into a contract count.
Using two at once
Many traders combine methods instead of choosing one. A common pairing places the stop by the chart, behind the level or beyond the structure, and uses ATR as a check: a stop well under one ATR is probably inside the noise, and one that needs several ATRs belongs to a trade worth skipping. A time rule on top handles the trades that neither work nor fail. Whatever the mix, it's decided before the entry and written into the plan, because a stop chosen after the entry tends to be chosen by the open P&L.
My own stops are the first kind: beyond the price that says the level failed, with room that depends on how the morning is trading. The size doesn't come from that distance. It starts at one MNQ and grows only with the cushion above the account's max loss floor.
Educational content, not investment advice. Futures trading involves substantial risk of loss. Examples are for illustration only. Read the full Risk Disclosure.