Moving Averages: What They Measure and Why Most Settings Are Arbitrary
A moving average summarizes recent closes, and the settings traders argue about change less than they think: an EMA(20) is no younger on average than an SMA(20). The arithmetic of SMA, EMA and WMA, where 20, 50 and 200 came from, and the one condition that turns an average into a level.
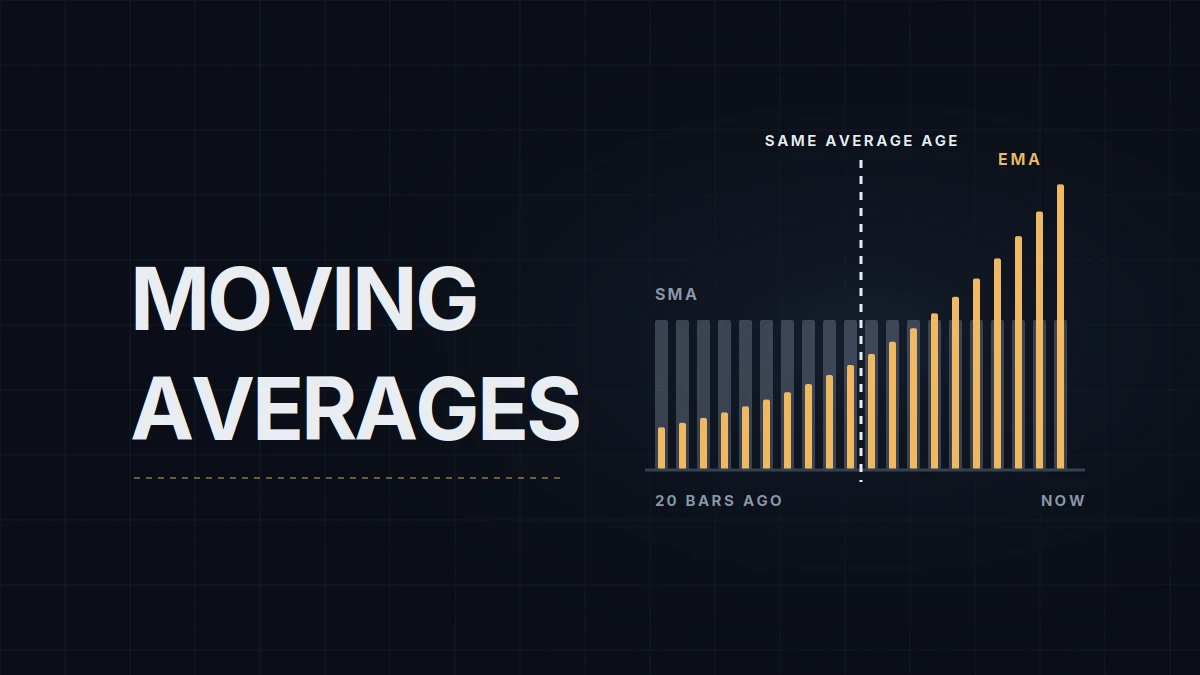
A 20-period exponential moving average and a 20-period simple moving average have the same average lag. Both are built from prices that are, on average, 9.5 bars old. The EMA is usually described as the faster of the two, and it does react more to the latest bar, but the difference lies in how the weight is spread across the bars, not in how old the average is. Much of what moving average trading rests on looks like that up close: a few arithmetic facts and a larger number of conventions.
How the lines on a chart relate to the bars under them starts with reading a price chart. VWAP, the volume-weighted average that starts from a fixed point and accumulates, has its own post; the averages here have a fixed length in bars and roll forward one bar at a time instead.
Three ways to average recent closes
A simple moving average, SMA(N), adds the last N closes and divides by N. Every bar in the window gets the same weight, 1/N, and a bar leaves the average completely when it falls out of the window.
A weighted moving average, WMA(N), gives the latest close a weight of N, the one before N − 1, and so on down to 1, then divides by the sum of the weights. Its data is on average a third of the window old rather than half, so it hugs price more closely than the other two.
An exponential moving average, EMA(N), updates itself each bar: new EMA = previous EMA + α × (close − previous EMA), with α = 2 ÷ (N + 1). Nothing ever leaves it completely. Each older bar's weight shrinks by a factor of (1 − α) with every new bar.
| Average | Weight on the latest close | Average age of the data | Weight outside the last N bars |
|---|---|---|---|
| SMA(20) | 5.0% | 9.5 bars | 0% |
| EMA(20) | 9.5% | 9.5 bars | 13.5% |
| WMA(20) | 9.5% | 6.3 bars | 0% |
| SMA(200) | 0.5% | 99.5 bars | 0% |
| EMA(200) | 1.0% | 99.5 bars | 13.5% |
The factor 2 ÷ (N + 1) is why the EMA and the SMA line up: it's exactly the value that gives an EMA the same average age as the SMA of the same length. The EMA puts nearly twice the weight on the latest close and pays for it with a tail. About 13.5% of its weight sits outside the last N bars, at any of the usual lengths, so a spike 30 bars back still leaves a trace in an EMA(20).
The SMA has a quirk of its own. When a bar leaves the window, its close leaves the average, so an SMA can move while price doesn't. If price sits still at 29,400 and the close dropping out of a 20-bar window was 29,340, the SMA rises 3 points on a bar where nothing happened.
Why 20, 50 and 200
The popular lengths come from daily charts and the calendar. A year has about 252 trading days, so 20 days is roughly a month, 50 about ten weeks and 200 about nine and a half months. They were convenient round numbers for someone reading daily bars, and they've been repeated ever since. The 9 and 21 common on intraday charts are conventions of the same kind; nothing about the market makes them special.
Neighboring settings differ less than the arguments about them suggest. An EMA(21) is on average half a bar older than an EMA(20), which on a 5-minute chart is two and a half minutes. Changing a length from 20 to 21 because the chart looked better last week mostly fits last week's noise, the same trap backtest vs live results describes for any tuned parameter.
On tick, volume or range bars, "20 periods" says nothing about time. A 20-bar average on a Range 30 chart, where each bar covers 7.5 points of NQ (the E-mini Nasdaq-100 future), can span a few minutes of a fast open and a couple of hours at lunch (bar types explained).
When an average works as a level
An average holds no information that the closes behind it don't. It can still matter when enough traders watch the same one: orders gather near it, commentary mentions it, and part of the reaction feeds itself. That happens with a few daily averages, the 200-day above all, and with little else. An EMA(9) on someone's 1,500-tick chart is private, because the data feed, the bar type and the session template all change it, and no crowd is watching the same line.
Futures add a wrinkle even to the public ones. The 200-day average in market news is usually the index's (the Nasdaq-100, or QQQ, the ETF that tracks it), and NQ trades at a premium to the index that depends on interest rates, dividends and the time left to expiration. A continuous NQ chart that back-adjusts at each rollover shifts older prices again. The index's 200-day and the 200-day on an NQ chart are two different prices, and the one the crowd watches belongs to the index.
Crossovers of two averages, such as the 50-day through the 200-day, carry the lag of both. They confirm a trend that is already months old, and in a range they flip back and forth.
My own chart carries one moving average, an SMA(25), and I rarely use it for anything on its own; the levels on it come from prices that traded, plus the day's gamma walls, option strikes converted to NQ and drawn dashed.
Educational content, not investment advice. Futures trading involves substantial risk of loss. Examples are for illustration only. Read the full Risk Disclosure.