Bookmap Setup for NQ: Heatmap Settings, Volume Dots and What to Turn Off
A dark heatmap and a blinding one have the same cause: two cutoff values. Setting them for NQ, filtering volume dots so absorption is readable, which columns earn their width, loading your levels as notes with alerts, and the panels and add-ons worth switching off.
Open the E-mini Nasdaq-100 (NQ) in Bookmap for the first time and the heatmap tends to fail in one of two ways: so dark that nothing stands out, or so bright that everything does. Both come from the same two settings, and the volume dots drawn on top have the same problem in a different panel. This is a Bookmap setup for NQ in the order the settings matter: the feed, heatmap contrast, volume dots, the columns on the right, getting your levels on screen, and a list of things to switch off. What the heatmap can and can't show, and what it costs, is in Bookmap for NQ. The execution side of the same desk starts with the NinjaTrader 8 chart setup.
Menu names are from Bookmap's knowledge base at the time of writing. Nearly everything below lives in one window, the Studies panel, opened with the microscope icon above the chart. Heatmap settings are stored per instrument, and whatever you applied last becomes the starting point for the next instrument you subscribe to, so tune NQ before opening anything else.
The feed decides what there is to set
The standard CME depth feed carries ten price levels on each side. On NQ, with a 0.25-point tick, that is about 2.5 points above and below the market. Prices further out still show on the heatmap, because Bookmap keeps drawing the last size it received for a level after the level leaves the transmitted range. That is useful and stale at once: a wall 15 points away may have been cancelled ten minutes ago and still glow.
In the Studies panel open Heatmap, then Advanced market depth settings. Reset inactive clears out-of-range levels that haven't updated for the number of minutes you set; a few minutes is enough to stop an old wall from sitting on the screen for an hour. Reset at the end of the day exists as well, but only works with a Rithmic connection. If you would rather watch fewer levels than the feed sends, Override number of market depth price levels sets a smaller active range.
Heatmap contrast: two cutoffs
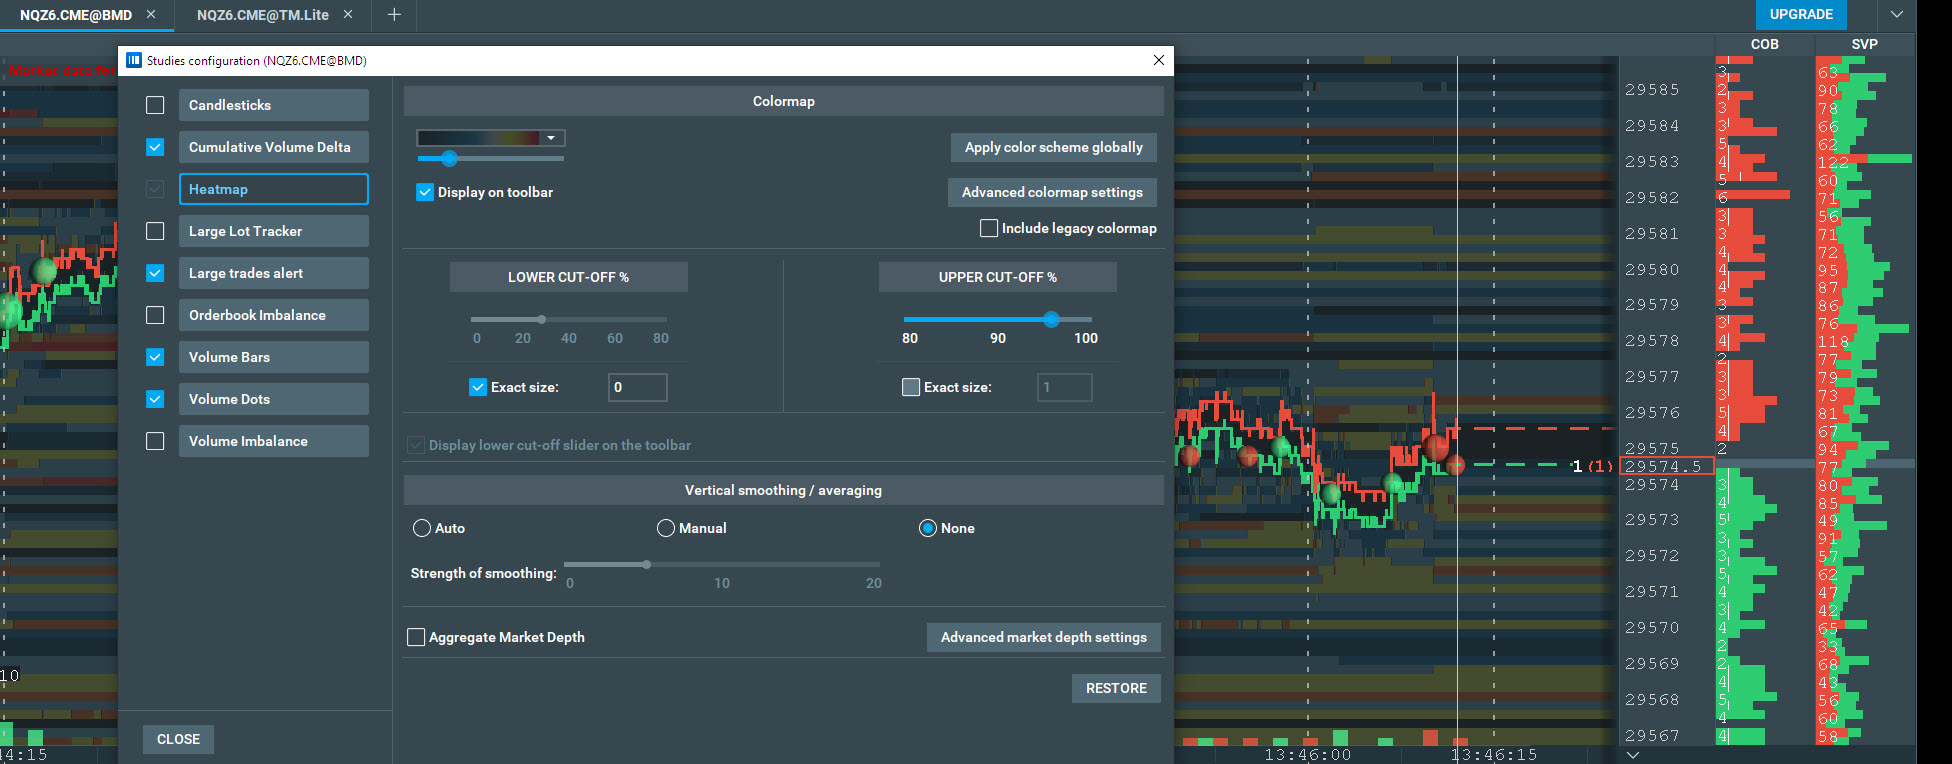
Every cell's color is its resting size placed on a scale between a lower cutoff and an upper cutoff. Size at or below the lower one is drawn in the darkest color, size at or above the upper one in the brightest, and everything in between is shaded by where it falls. Both cutoffs can be set as a percentile or as an exact number of contracts, and that choice matters more than the values.
A percentile is relative. An upper cutoff of 95% lights the largest 5% of whatever is in the book right now, so the brightest color stands for a much smaller wall during European hours than after the US cash open, when NQ depth is much thicker. The picture always looks balanced, and the same color means different sizes at 9:00 and at 15:30 CEST. An exact number is absolute: 400 contracts is 400 contracts all day, and a thin book simply looks dark, which is information too.
A practical way to get there:
- Start on percentiles and trade or replay a session with them.
- In drag mode, scroll back to the walls price reacted to, hover over them and read the size in the data tooltip. Depending on your plan, drag mode reaches back one hour or 24.
- Set the upper cutoff as an exact number a little below the typical size of those walls. Anything that size or larger is now fully lit.
- Raise the lower cutoff until the one- and two-lot noise near the market goes dark. Tick Display lower cut-off slider on the toolbar so this one slider sits above the chart for adjustments during the session.
If you trade both the European morning and the US open, one exact value will be too high for the first and too low for the second. Either accept a darker morning or keep two values written down and switch at the open.
| Setting | Where | Starting point |
|---|---|---|
| Colormap | Heatmap settings | the default black-to-red scale, or the legacy grayscale; then Apply color scheme globally |
| Upper cutoff | Heatmap settings | exact contracts, found as above |
| Lower cutoff | Heatmap settings, toolbar slider | high enough to hide the smallest orders |
| Vertical smoothing | bottom of Heatmap settings | None at normal zoom; Auto only when zoomed far out, since smoothing blurs single-tick walls |
| Aggregate Market Depth | Heatmap settings | off; the cumulative view hides where the size sits |
| Dimming | toolbar | as dark as you can still read comfortably |
If colors shift every time the chart recenters, that is the automatic contrast adjustment. How often it runs is set under Advanced colormap settings in the same window.
Volume dots
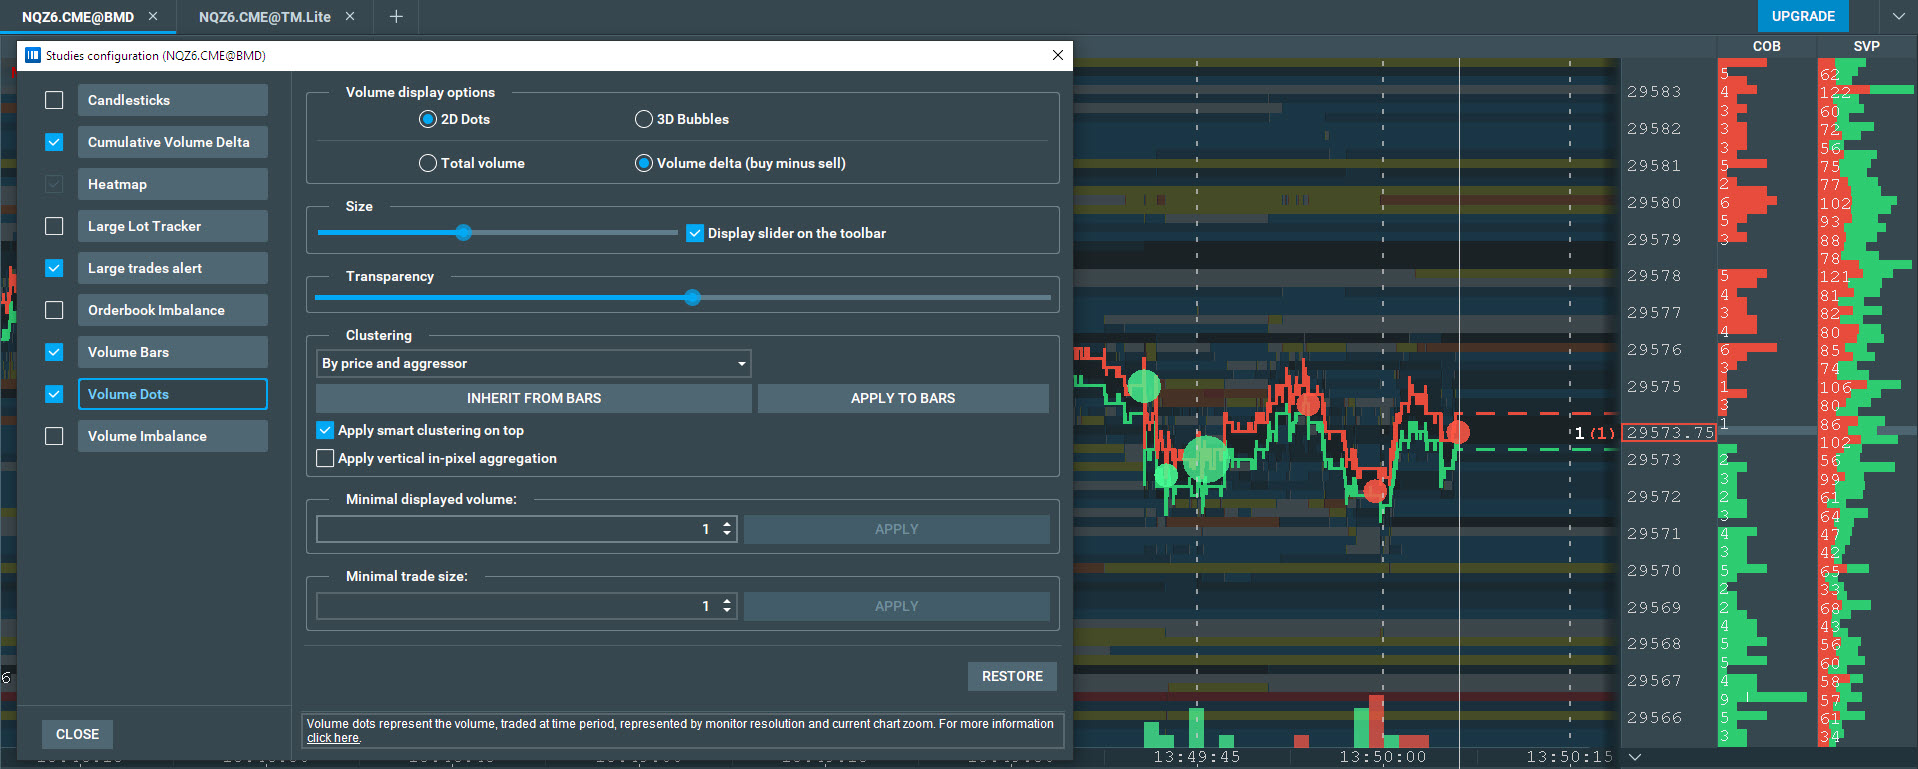
Each dot is the volume traded during one pixel's worth of time, placed at that period's volume-weighted price, and colored by which side was aggressive. Open Volume Dots in the Studies panel; the knowledge base still calls them volume bubbles in places. Four groups of settings matter.
Filtering. Two different filters sit here and they are easy to confuse. Minimal Trade Size hides any single print smaller than the number. Minimal Displayed Volume hides a dot whose total volume inside one pixel is below the number, so a burst of one-lots that adds up to a large amount still shows. On NQ most prints are small, which means a trade-size filter alone hides the aggressive bursts you most want to see. Filter on displayed volume and raise it until the dots that remain are ones you would act on.
Clustering. This decides how prints are merged into dots. Smart merges adjacent or overlapping dots by an internal algorithm, and a separate Apply smart clustering on top box layers that merge over whichever method the dropdown is set to. By time and By volume paint a dot per interval or per fixed amount traded. By price merges everything at one price until trading moves to another. By price and aggressor keeps merging at one price until the aggressive side changes, and it is the one that suits a reversal read at a level: a run of sells into a bid that won't move grows into one large sell dot sitting on the level, which is what absorption looks like. Apply to Bars copies the choice to the volume bars at the bottom.
Display. 2D or 3D, and total volume or delta per dot. Total volume in 2D keeps the dot's size meaning one thing. The knowledge base also describes a Drawing type choice, Gradient, Solid or Pie, for how the buy and sell shares are drawn on one dot; the build in the screenshot below doesn't have it in this panel.
Size and transparency. Large dots cover the heatmap under them. Some transparency keeps the wall visible behind the prints that are hitting it, which is the whole point of the picture.
Columns on the right
The strip to the right of the chart is a set of columns, and each can be switched by right-clicking it. Three earn their width on NQ. COB, the current order book, shows the resting size at each price as bars with a scale number on top. SVP, the session volume profile, accumulates traded volume from the moment you subscribed to the instrument, so start Bookmap before your session or the profile starts halfway through it. +/- Quotes Delta shows liquidity added or pulled at each price since the last change of best bid and ask, which is the pulled-wall behavior in numbers.
Time & Sales, the trades counter and the quotes counter can go unless you read them. To start every day with clean accumulations, File › Refresh Bookmap takes a scheduled daily refresh; set it before your window opens.
Getting your levels on screen
Levels come from your prep, and the list of which ones is in the key levels post. Bookmap has two ways to show them. The drawing tools include a horizontal line, which is quick for two or three prices. The Custom Notes column is better for a full list: add a note at a price, give it a line on the chart, and import or export the whole set as a CSV file, so a list prepared once can be loaded in one step. Each note can carry a price alert on its Notifications tab, with an offset from the price and a sound, which is the Bookmap counterpart of alerts on NinjaTrader drawings.
Levels belong to a contract. After the quarterly roll, the note file for the old contract describes prices the new one isn't trading at.
What to turn off
| Element | Where | Why it goes |
|---|---|---|
| Trading DOM column and trade control panel | right-click the column; visible components settings | if orders go through NinjaTrader, a second order-entry surface is one misclick from a position on the wrong platform; the Bookmap DOM also has no market orders |
| Candlestick view | Studies panel | the chart lives on the execution platform; candles over the heatmap hide the dots |
| VWAP and POC lines | Studies panel | if they are already in your level list, two sources for one number will eventually disagree |
| CVD sub-chart | Studies panel | keep one delta reading on screen, wherever you already read it |
| Imbalance, large-lot, sweep and other add-ons | Studies panel, Settings › Configure Addons | each adds markers to the same picture; add one when you have a question it answers |
| Stops & Icebergs | add-on | needs CME market-by-order data from Rithmic or Bookmap's own feed, in non-aggregated mode; without that data it has nothing to show |
| Voice alerts and trade sounds | per study in the Studies panel; Settings › Configuration for trades | keep sound for the alerts on your levels only |
Keeping it smooth
Bookmap redraws at 40 frames per second by default. On a machine that stutters, lower it under Settings › Chart refresh rate; below 15 the motion is visibly choppy. The same window has Presentation Mode, which keeps the full frame rate for screen recordings such as Camtasia or OBS. If the graphics card is the problem, GPU acceleration can be switched off so the CPU does the drawing.
For vertical movement, right-click the price axis. Re-centering on Last Price with an absolute tolerance holds the view still until price has moved that many points, and a still picture is easier to read than one that drifts with every tick. The stopwatch icon above the chart sets how much time is visible.
My Bookmap window has no order entry on it. Orders go through NinjaTrader, and Bookmap stays next to the chart to answer one question at levels marked before the session.
Educational content, not investment advice. Futures trading involves substantial risk of loss. Examples are for illustration only. Read the full Risk Disclosure.