NinjaTrader 8 Performance: Why Charts Lag, Freeze or Stutter and How to Fix It
A chart that trails price, a window that stops responding and a chart that jerks while scrolling are three different problems with three different causes. How to tell them apart, the settings that cost nothing to change, how to find the one script eating the CPU, and when to blame the hardware.
"NinjaTrader lagging" covers three different complaints, and the fix for one does nothing for the others. Before touching a setting, work out which one you have.
| Symptom | What is happening | Where to look first |
|---|---|---|
| Lag: the chart trails the price in the DOM or the Control Center, worst on fast moves | The platform can't finish processing each incoming tick before the next ones arrive, so a queue builds | Scripts running On each tick, Tick Replay, too many tick-based series |
| Freeze: a window stops responding for seconds, sometimes with "Not Responding" in the title bar | Something is blocking the user-interface thread: loading history, a script doing heavy work on the UI, a large workspace opening | The moment it happens (connect, workspace load, a news spike), then the Utilization Monitor |
| Stutter: price is current, but scrolling, zooming or the crosshair moves in jerks | Rendering, not calculation: the graphics card or the number of objects being drawn | GPU selection, drawing objects, global crosshairs |
Lag is the dangerous one. A stop that looks 4 points away on a chart running 3 seconds behind can already be filled. If you trade from a lagging chart, trade from the SuperDOM until it's fixed. The chart basics this post builds on, bar types and Data Series settings, are in the NinjaTrader 8 chart setup guide.
The settings that cost nothing
NinjaTrader's own help guide lists twenty performance tips. These are the ones that fix most lag on an NQ or MNQ workspace, in the order worth trying them.
- Calculate mode on every indicator. Each indicator has a Calculate setting: On bar close, On price change or On each tick. On each tick runs the indicator's code for every trade that prints. NinjaTrader's guidance is that there is no benefit to On each tick unless the indicator counts volume or ticks. A moving average only needs to update when price changes; switching it to On price change skips every tick that printed at the same price.
- Days to Load. Open Data Series (Ctrl+F on the chart) and look at how much history each chart pulls. A 2000-tick chart with 30 days loaded holds several times more bars than the same chart with 5 days, and every indicator has to run through all of them on load. Tick-based and range charts benefit most from trimming this.
- Charts you aren't watching. Closed tabs are free; open tabs in a background workspace are not. NinjaTrader keeps every open workspace running whether or not it's on screen.
- Same-instrument clutter. Ten charts of MNQ all process the same tick stream. The help guide notes that workspaces with one or few instruments can't spread the work across processor cores the way many different instruments can, so a faster single core helps more than more cores.
- Drawing objects. Months of old lines, rays and text labels are redrawn on every render. Delete the ones from last week.
- Restart once a day. Memory is released on exit. Set the connection to connect on startup, so the workspace loads once, not twice.
Tick Replay and history
Tick Replay rebuilds historical bars tick by tick so an indicator can see the order in which trades happened, which is what a volume profile or a delta indicator needs. It is off by default. To see the option at all, go to Control Center › Tools › Settings › Market data (Options in older builds) and check "Show Tick Replay"; after that each indicator and chart gets its own Tick Replay checkbox.
The cost is load time and memory, multiplied by Days to Load. A simple pivot indicator gains nothing from it. If Tick Replay is on for a chart that only carries levels and a moving average, turn it off. If you need it for one order-flow indicator, give that indicator its own chart with fewer days loaded.
Finding the script that eats the CPU
One badly written indicator can slow a whole workspace, and it's rarely the one you suspect. NinjaTrader has a tool for this.
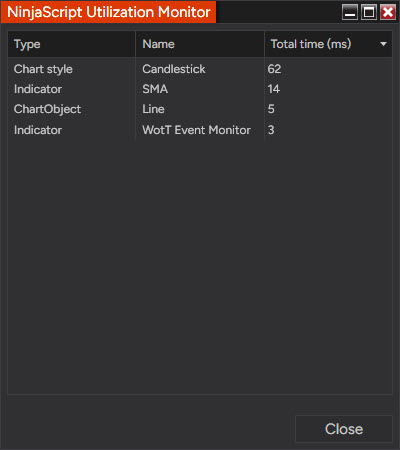
Open New › NinjaScript Output, right-click inside the window and choose NinjaScript Utilization Monitor. It lists every running script sorted by the time it spends processing. Let it run for two to five minutes during an active session, not overnight, then look at the top of the list. A single entry with far more total time than the rest is your suspect. Remove it from one chart and watch whether the lag goes away.
Two things confuse the reading. A third-party indicator that calls built-in ones, an EMA for example, can make the EMA appear at the top when the real cost belongs to the add-on. And bar types show up generically: any tick-based bar type, range included, is listed as a 1 Tick series.
Safe Mode: platform or workspace?
If the Utilization Monitor shows nothing unusual, find out whether the problem is NinjaTrader itself or what you've loaded into it.
Exit NinjaTrader. Hold Ctrl and double-click the NinjaTrader icon, keeping Ctrl held until the Control Center appears. Help › About confirms Safe Mode. In Safe Mode the platform doesn't load workspaces, doesn't connect on startup, doesn't load custom assemblies and doesn't fetch instrument updates.
Connect, open one chart without custom indicators and watch a fast period. Smooth means the platform and the machine are fine and the cause is in your workspace or add-ons. Then open your workspace (close it first without saving if it was the last one used) and add scripts back one at a time until the lag returns. Slow even in Safe Mode means the machine, the connection or the data volume.
Hardware, Windows and the connection
Laptops often have two graphics processors, and Windows may hand NinjaTrader the weaker integrated one. Assign it the dedicated GPU in the Windows graphics settings. On weaker graphics cards, setting the chart crosshair to draw the cursor only, and turning off global crosshairs on charts that don't need them, removes a lot of rendering.
Windows search indexing competes with NinjaTrader for disk and processor. The help guide recommends excluding Documents\NinjaTrader 8 and Program Files (x86)\NinjaTrader 8 from indexing. A large simulated trade history also grows the database: if you don't need old Sim101 results, reset the account. Market recording for Playback costs resources while it runs; switch it off if you don't use Market Replay.
Wi-Fi drops packets that a cable doesn't, and a data burst after a dropout looks like lag on the chart. For anything that trades, use a wired connection.
Running Bookmap next to NinjaTrader
Many NQ traders run a heatmap beside NT8, and the two compete for the same graphics card and the same cores. The heatmap redraws continuously, NinjaTrader redraws on every tick, and on a four-core laptop both slow down in exactly the minutes that matter. Before blaming either program, close one during a fast period and see whether the other recovers. If it does, the fix is hardware or dividing the work: order-flow indicators off the NT8 chart when the heatmap already shows the same thing.
I keep the NT8 chart bare, key levels and a range chart, and leave order flow to the heatmap, partly for this reason.
When it still lags
If none of this helps, the logs usually show why. Documents\NinjaTrader 8\log and \trace hold the day's files, and NinjaTrader support asks for them first. Sending them with the time of the freeze and what was open saves a round of emails.
Educational content, not investment advice. Futures trading involves substantial risk of loss. Examples are for illustration only. Read the full Risk Disclosure.