Market Internals for NQ: NYSE TICK, ADD and VOLD Explained
NQ is up 80 points, but is the whole market buying or are five megacaps carrying the index? NYSE TICK, ADD and VOLD answer that. What each one counts, how the readings look on trend and range days, why NQ can diverge from them, and how to get them in TradingView and NinjaTrader.
It's 10:40 AM ET and NQ has pushed 80 points off the open. The chart shows the move. It can't show whether the whole market is buying or whether a handful of megacaps are carrying the index while everything else drifts. Market internals answer that second question. They are breadth readings computed from every stock listed on an exchange, they update through the cash session, and they tell you how wide a move is, which the price of a single futures contract never will.
None of them change what NQ is worth per point (the NQ vs MNQ guide covers that). They change how much weight you put on what the chart is doing.
What each one counts
| Internal | What it counts | TradingView symbol | Readings traders treat as extreme |
|---|---|---|---|
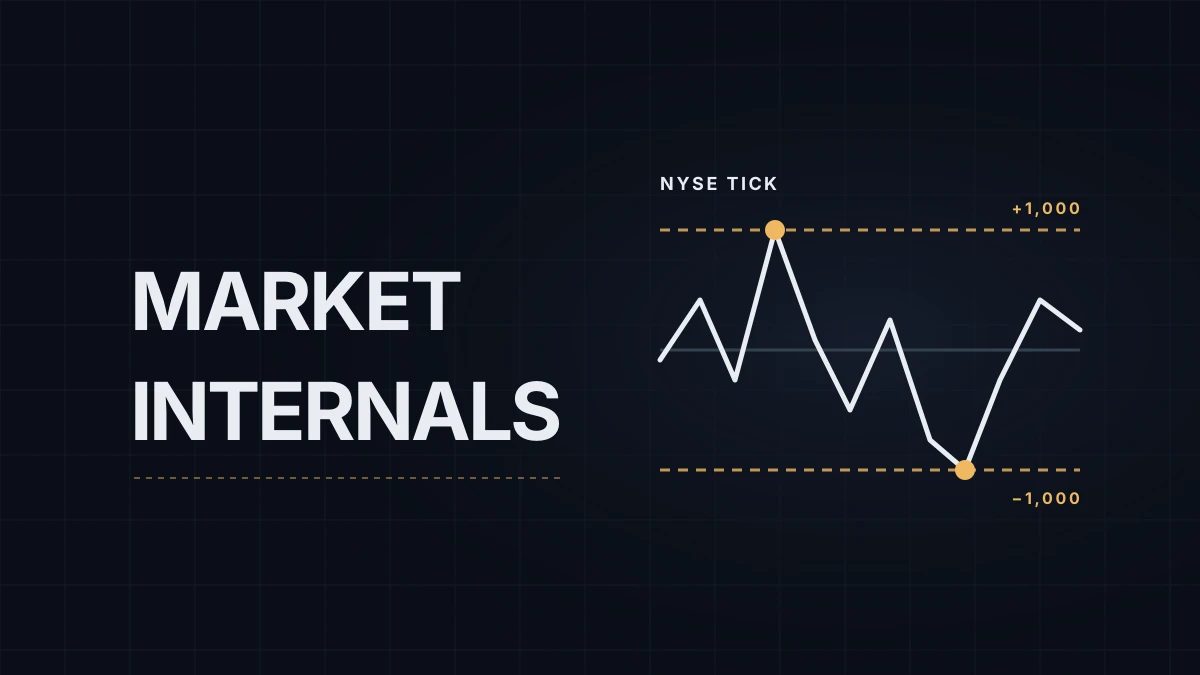
| NYSE TICK | NYSE stocks whose last trade was an uptick, minus those whose last trade was a downtick, at this moment | USI:TICK | beyond +1,000 or −1,000 |
| NYSE ADD | NYSE stocks up on the day minus stocks down on the day | USI:ADD | beyond ±1,000; ±2,000 on strong days |
| NYSE VOLD | Volume traded in advancing stocks minus volume in declining stocks | USI:VOLD | beyond ±500 million; ±1 billion on strong days |
| Nasdaq TICK | The TICK count for Nasdaq-listed stocks | USI:TICKQ | its own range; learn it from your chart |
The thresholds in the last column are conventions traders use, not levels the exchange publishes, and they stretch on heavy-volume days. Nasdaq versions of ADD and VOLD exist as well: USI:ADDQ and USI:VOLDQ on TradingView.
The three readings also run on different clocks. TICK is a snapshot: it can swing from +800 to −600 in two minutes. ADD and VOLD describe the day so far, so they move slowly and their shape across the session tells you more than any single value.
Reading them next to NQ
TICK is the fast one. A print above +1,000 means a wave of buying hit a large share of the market at once, the kind of footprint index arbitrage and program orders leave. On a range day those spikes tend to mark the end of a push, and they alternate: +1,000 in the morning, −1,000 an hour later. On a trend day the extremes come from one side only, and TICK spends most of the session above zero (or below it). That persistence is more useful than any single spike, and it fits the early trend-day signals in trend day vs range day.
ADD is the participation gauge. A line that climbs steadily from the open says most stocks are joining the move. A line that hovers around zero and crosses it again and again says money is rotating between sectors, which is what a balanced, two-sided market looks like on the chart (the market structure guide describes that picture from the price side).
VOLD weighs the same thing by volume. When ADD is flat but VOLD keeps rising, the advancing stocks are the heavily traded ones, which on most days means large caps.
Why NQ can disagree with all three
The Nasdaq-100 is weighted by market value, so a few companies account for a large share of every move (the weights breakdown has the current list). The NYSE internals count every NYSE-listed stock once and include none of the Nasdaq-100 members, which must list on Nasdaq. NQ can therefore rise 1% while NYSE ADD sits at −800, because the stocks that carry the index are rallying and the rest of the market isn't.
Neither reading is wrong, and a narrow rally can run for days. What the divergence tells you is how fragile the move is: it depends on a few names, so one earnings report or one analyst downgrade can undo it. The NYSE readings also include banks, utilities and real estate, which react to interest rates differently from tech. On a day when yields jump, NYSE internals can look weak while NQ holds up, or the reverse. TICKQ is closer to what NQ trades, though it still counts the smallest Nasdaq stock as heavily as the largest.
When they stop being useful
The internals update only during the stock market session, 9:30 AM to 4:00 PM ET (15:30 to 22:00 in Central Europe for most of the year). Overnight NQ trades on Globex with no internals at all. The first few minutes after 9:30 are noisy, because opening auctions and imbalance orders produce TICK readings that mean very little. And the "extreme" levels drift: a ±1,000 TICK is ordinary on a CPI morning.
Where to get them
TradingView lists them with the USI: prefix. Check whether your chart shows them in real time or delayed; the TradingView data guide explains how to tell.
NinjaTrader 8 has ^TICK and ^TICKQ as index instruments. They only fill if your connection carries index data, and NinjaTrader's data-by-provider list marks Rithmic as futures only. On a prop account connected through Rithmic, ^TICK stays blank. CQG-based connections list index data, though real-time ^TICK may need an extra index-data subscription. That's why many futures traders keep internals in a TradingView tab beside their NT8 charts (the TradingView vs NinjaTrader comparison covers what each platform is good at).
Educational content, not investment advice. Futures trading involves substantial risk of loss. Examples are for illustration only. Read the full Risk Disclosure.