Risk-Reward Ratio Explained: Why 1:2 Isn't a Rule
The ratio chosen at entry doesn't create an edge: move the target and the win rate moves with it. Two hypothetical setups show why one pays best at 1R and the other at 3R, what costs do to tight stops, and the one job a minimum ratio does well.
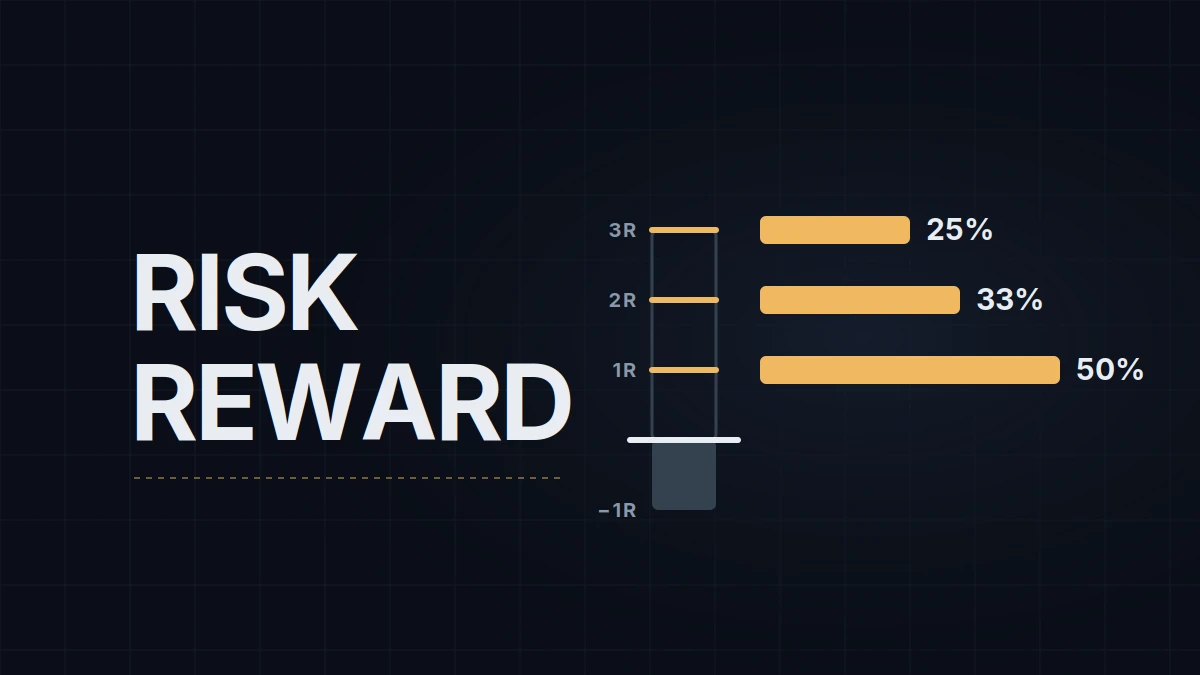
Search for a risk reward ratio in trading and most answers land on 1:2: risk one to make two, and you can be wrong two times in three and still break even. The arithmetic is right. The rule people build on it, a target at twice the stop on every trade, doesn't follow from the arithmetic.
The ratio compares two distances measured from the entry, to the stop and to the target. A stop 20 points away with a target 40 points away is 1:2; some write the same trade as 2:1, reward to risk. Everything below is in R, where 1R is the amount at risk on the trade (stop distance × point value × contracts), so a target at twice the stop is a 2R target. The expectancy post has the grid of win rate against payoff; this one is about why you can't pick a cell in that grid by picking a ratio. If price charts are new, reading a price chart comes first; the stop and target orders themselves are in order types explained.
The target sets the win rate
Start with a market that has no edge in it: a random walk, where every tick is as likely to go up as down. The chance that price reaches +X R before it reaches −1R is 1 ÷ (1 + X), an old result from probability theory known as gambler's ruin.
| Target | Hit before the stop on a random walk | Expectancy |
|---|---|---|
| 0.5R | 66.7% | 0 |
| 1R | 50.0% | 0 |
| 1.5R | 40.0% | 0 |
| 2R | 33.3% | 0 |
| 3R | 25.0% | 0 |
Every row breaks even, and the hit rates are exactly the break-even row of the expectancy grid. On a market with no edge, a wider target buys a bigger win with a lower win rate at a fixed exchange rate. A 1:2 target there wins a third of the time and makes nothing, the same as a 1:1 target winning half the time. Choosing a ratio moves you along that line. It can't lift you off it.
A setup has an edge where its hit rates sit above the line, and where they sit above it decides which target pays.
Two setups, two best targets
Take two hypothetical setups on the E-mini Nasdaq-100 (NQ), both with a 20-point stop, and suppose a journal of a few hundred trades shows how often price reached each target before the stop. Setup A is a fade at a level: the reaction comes quickly or not at all. Setup B is a breakout: a noisy start and a long tail.
| Target | Random walk | Setup A hit rate | Setup A expectancy | Setup B hit rate | Setup B expectancy |
|---|---|---|---|---|---|
| 0.5R | 66.7% | 72% | +0.08R | 64% | −0.04R |
| 1R | 50.0% | 57% | +0.14R | 48% | −0.04R |
| 1.5R | 40.0% | 44% | +0.10R | 40% | 0.00R |
| 2R | 33.3% | 34% | +0.02R | 36% | +0.08R |
| 3R | 25.0% | 22% | −0.12R | 30% | +0.20R |
Setup A earns the most at 1R, 0.14R a trade. At 1:2 it keeps 0.02R, and at 3R it loses. Setup B loses at every target up to 1R, breaks even at 1.5R and earns the most at 3R, 0.20R a trade; at 1:2 it earns 0.08R and leaves more than half of its edge on the table. A fixed 1:2 costs both of them, in opposite directions.
The numbers are invented; the shape is common. Fades tend to deliver their edge early and breakouts late, and your own setup's curve comes from your trades, not from a rule. The MAE and MFE post covers the raw material: the maximum favorable excursion (MFE) of each trade, the furthest it moved your way before the exit. Counting how many trades reached each distance gives the curve, with one catch: a trade closed early, at a target, by a trail or by hand, stops counting at the exit, so for those the chart after the exit, up to where the original stop would have been hit, fills in the rest.
Costs raise the bar: a setup's hit rate has to beat the random-walk column by enough to pay for them, not just beat it. Trade the same setups on the Micro E-mini Nasdaq-100 (MNQ), which moves point for point with NQ: the fees breakdown puts a round turn at $1.90 at the time of writing, just under a point at $2 a point; add a tick of slippage on the stop and call it 1.2 points. On a 20-point stop that is 0.06R a trade, which turns Setup A at 1:2 into a loser. On a 10-point stop the same costs come to 0.12R, nearly all of an edge the size of Setup A's best. On NQ the round turn is about $5.70, under 0.3 points at $20 a point, so the same costs come to about 0.03R and 0.05R. The tighter the stop, the bigger the share of every R that goes to costs.
That is also why a ratio can't be repaired by tightening the stop. Cut the stop from 20 points to 10 so the same target counts as 2R instead of 1R, and what you have is a different setup, with hit rates nobody has measured and double the costs in R. The sizing post makes the same argument from the other side: the stop belongs to the setup, the size belongs to the account.
What a minimum ratio is good for
As a target, a fixed multiple is arbitrary. As a filter, a minimum ratio does a real job: it asks whether the trade has room. If the setup needs a 20-point stop and the next level in the trade's path, the prior day's high above a long for example, sits 15 points away, the trade can make 0.75R before it runs into a place where price is likely to stall. A minimum distance to the next obstacle, measured in R, filters those trades out before entry, and it's the useful core of the 1:2 habit.
The minimum should come from the setup too. Setup A only needs room for 1R, and demanding 2R of room would throw away trades that pay. Setup B needs close to 3R, and a trade with 2R of room has to be managed to a worse exit. The levels you mark before the session are what the room is measured against.
Planned ratio, realized ratio
How the exit is managed decides whether a ratio exists at entry at all. The common variants:
- A fixed target at a set multiple. The win rate follows from the multiple, and it's the easiest version to test and to journal.
- A target at the next level. The ratio changes from trade to trade, and the minimum ratio works as the filter above.
- A partial exit, part of the position at 1R and the rest trailed. More trades make something, the average winner shrinks, and the realized ratio is a blend of the two.
- A trailing stop with no target. There is no ratio at entry; the payoff is whatever the trail captures, measured afterwards as the average winner in R.
Whichever it is, the ratio that pays is the realized one: the average winner in R against the average loser in R, taken from the journal. It drifts from the planned one in both directions. Targets taken early and slippage on stops pull it down; losers closed before the stop push it up.
My own exits start from a target of about 35 points, a base that moves with the day's conditions. When the move has room for more, I don't close at 35; from there a trailing stop takes over. In the terms of the list above that's a target that turns into a trail, so a ratio exists at entry, but the number I watch is the realized one, and it takes a couple of hundred trades to settle.
Educational content, not investment advice. Futures trading involves substantial risk of loss. Examples are for illustration only. Read the full Risk Disclosure.