Free Volume Profile for NQ: TradingView Instead of the Paid NinjaTrader Add-On
Three numbers from yesterday's profile are worth marking before the open, and NinjaTrader charges for the tool that draws them. Four ways to get POC, VAH and VAL without Order Flow+, what each costs, a session profile in TradingView, and the five-minute routine that moves the levels to NT8.
The volume profile that ships with NinjaTrader 8 is part of Order Flow+, and Order Flow+ comes with every NinjaTrader brokerage plan once the account is funded, or as a $59-a-month add-on without one. Some prop firms, Lucid among them, include it with the Tradovate login they issue, which is a subject for a separate post; on a prop login that does not, it is a paid extra. The three numbers most NQ traders want from the profile, the point of control and the two edges of the value area, do not need any of that. They can be read from a profile drawn elsewhere and carried onto the NinjaTrader chart as three horizontal lines, which is a five-minute job before the open.
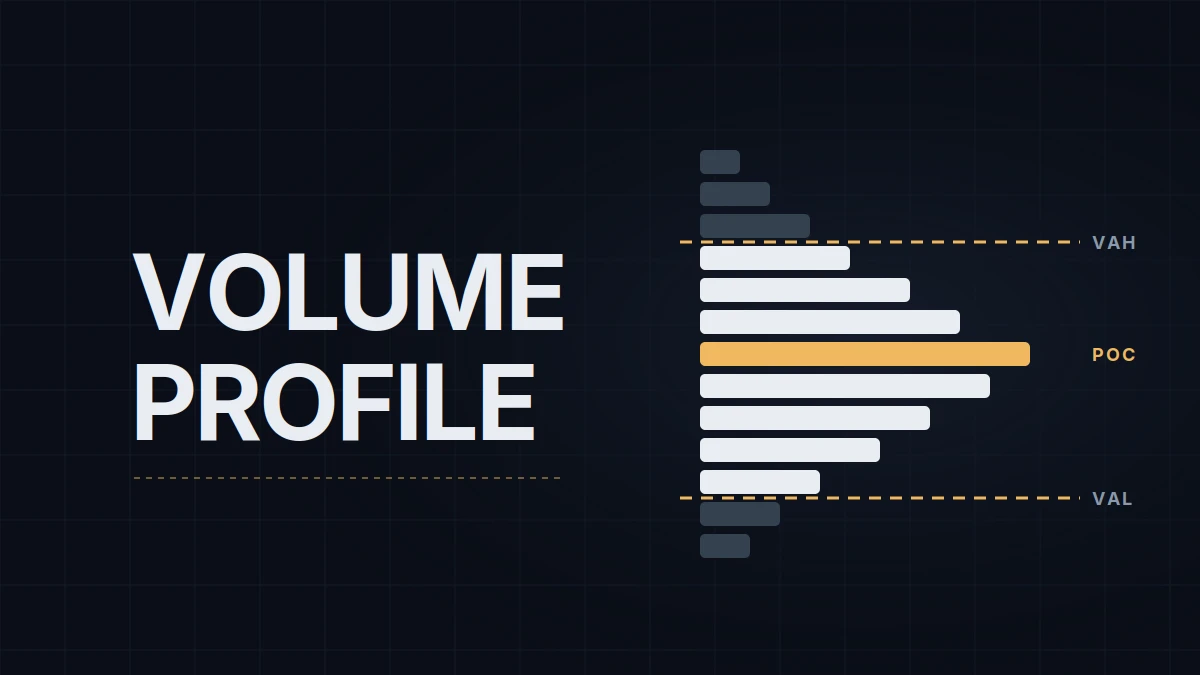
A volume profile is a histogram of volume by price for a chosen window, usually one session. Its peak is the POC, the price where the most contracts traded. It is the most common price of the session, where VWAP is the average one. The value area is the band of prices around the POC that contains 70% of the session's volume, and its edges are the VAH and VAL. What those levels mean on the chart and how traders use them is covered with the other levels; this post is about getting them cheaply.
Four ways to get the three numbers
| Route | Cost at the time of writing | Gets you | Doesn't |
|---|---|---|---|
| NinjaTrader Order Flow+ | included with a funded NinjaTrader brokerage account on any plan; $59 a month as a standalone add-on | session, composite and developing profiles on the chart you trade, with POC/VAH/VAL lines drawn for you | come with every prop-firm login |
| NinjaTrader's built-in Volume Profile indicator | free | a live profile that builds from the moment you add it; with Tick Replay enabled on the data series it also builds the current session from history | value area lines, previous sessions, anything that survives a chart reload |
| TradingView built-in profiles (Session, Visible Range, Fixed Range) | Essential plan, around $13 a month billed annually | clean session profiles, value area with an adjustable percentage, rows by ticks or count | live use inside NinjaTrader; real-time CME data is a separate subscription |
| TradingView community scripts on the free plan | free | a session profile computed from lower-timeframe data, POC and value area in most versions | more than two or three indicators per chart; quality varies by author |
Two of the four are free, and for the pre-session routine the free ones are enough: yesterday's profile is finished, so the delayed feed on a free TradingView plan draws it exactly as a paid one would.
Setting up a session profile in TradingView
- Open NQ1! or the explicit month (NQZ2026 for December). The continuous symbol is convenient and has one trap, covered below. NQ rather than MNQ: same prices, ten times the volume, a cleaner histogram.
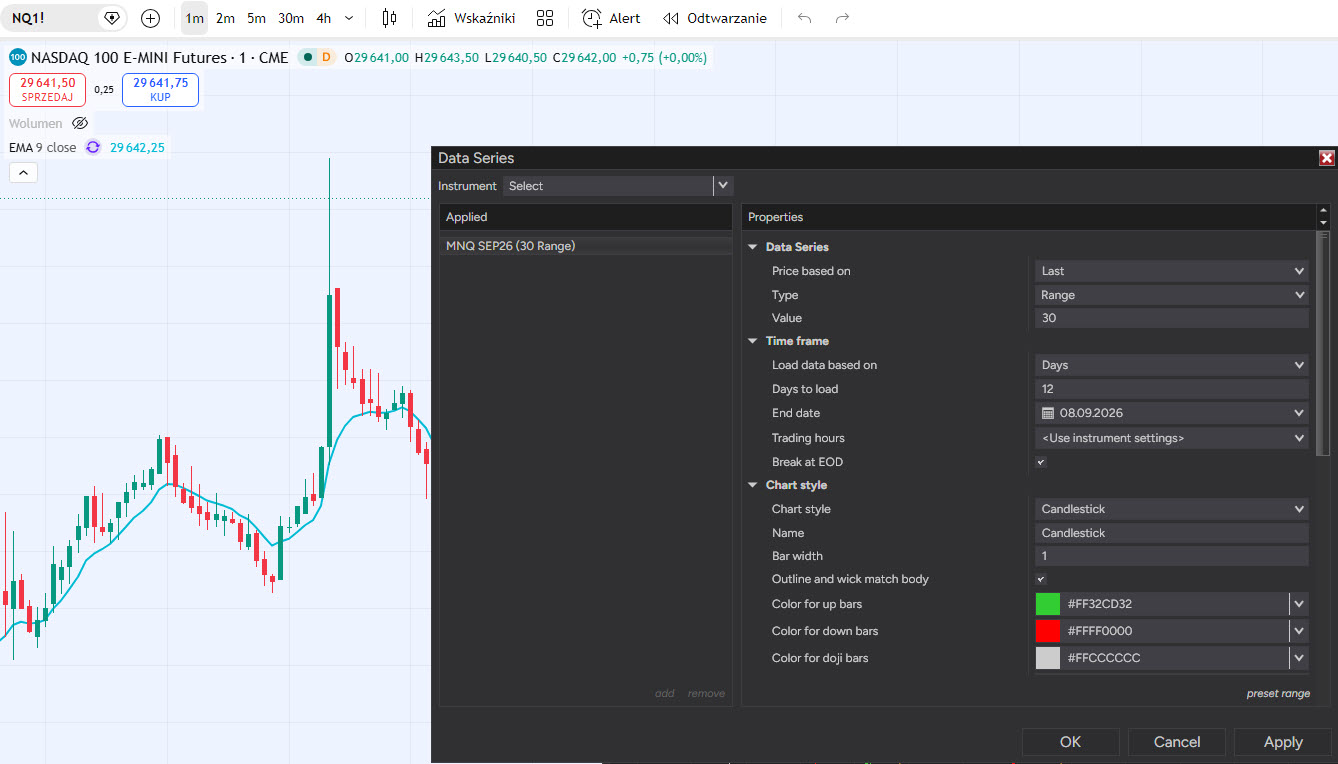
- Add the profile. On a paid plan: Indicators, Session Volume Profile. On the free plan: Indicators, Community, search "session volume profile" and pick a script with a session input and a value area output; check that its POC lands where the tallest row visibly is before trusting it.
- Set the session. Decide whether you want the profile of the regular session, 9:30 AM to 4:00 PM ET (15:30 to 22:00 CEST), or of the whole Globex day. Most level traders mark the regular session and treat the overnight separately. TradingView's session profile follows the chart's session settings; the Fixed Range tool, dragged across the hours you want, is the unambiguous alternative.
- Set the rows. Ticks per row is the setting to use on NQ; 8 ticks gives one row per 2 points, which is fine enough for a level and coarse enough to read. Leave the value area at 70%.
- Read three numbers from yesterday's finished profile: POC, VAH, VAL. Round each to a tick (0.25). Write them down before touching NinjaTrader.
Carrying the levels to NinjaTrader
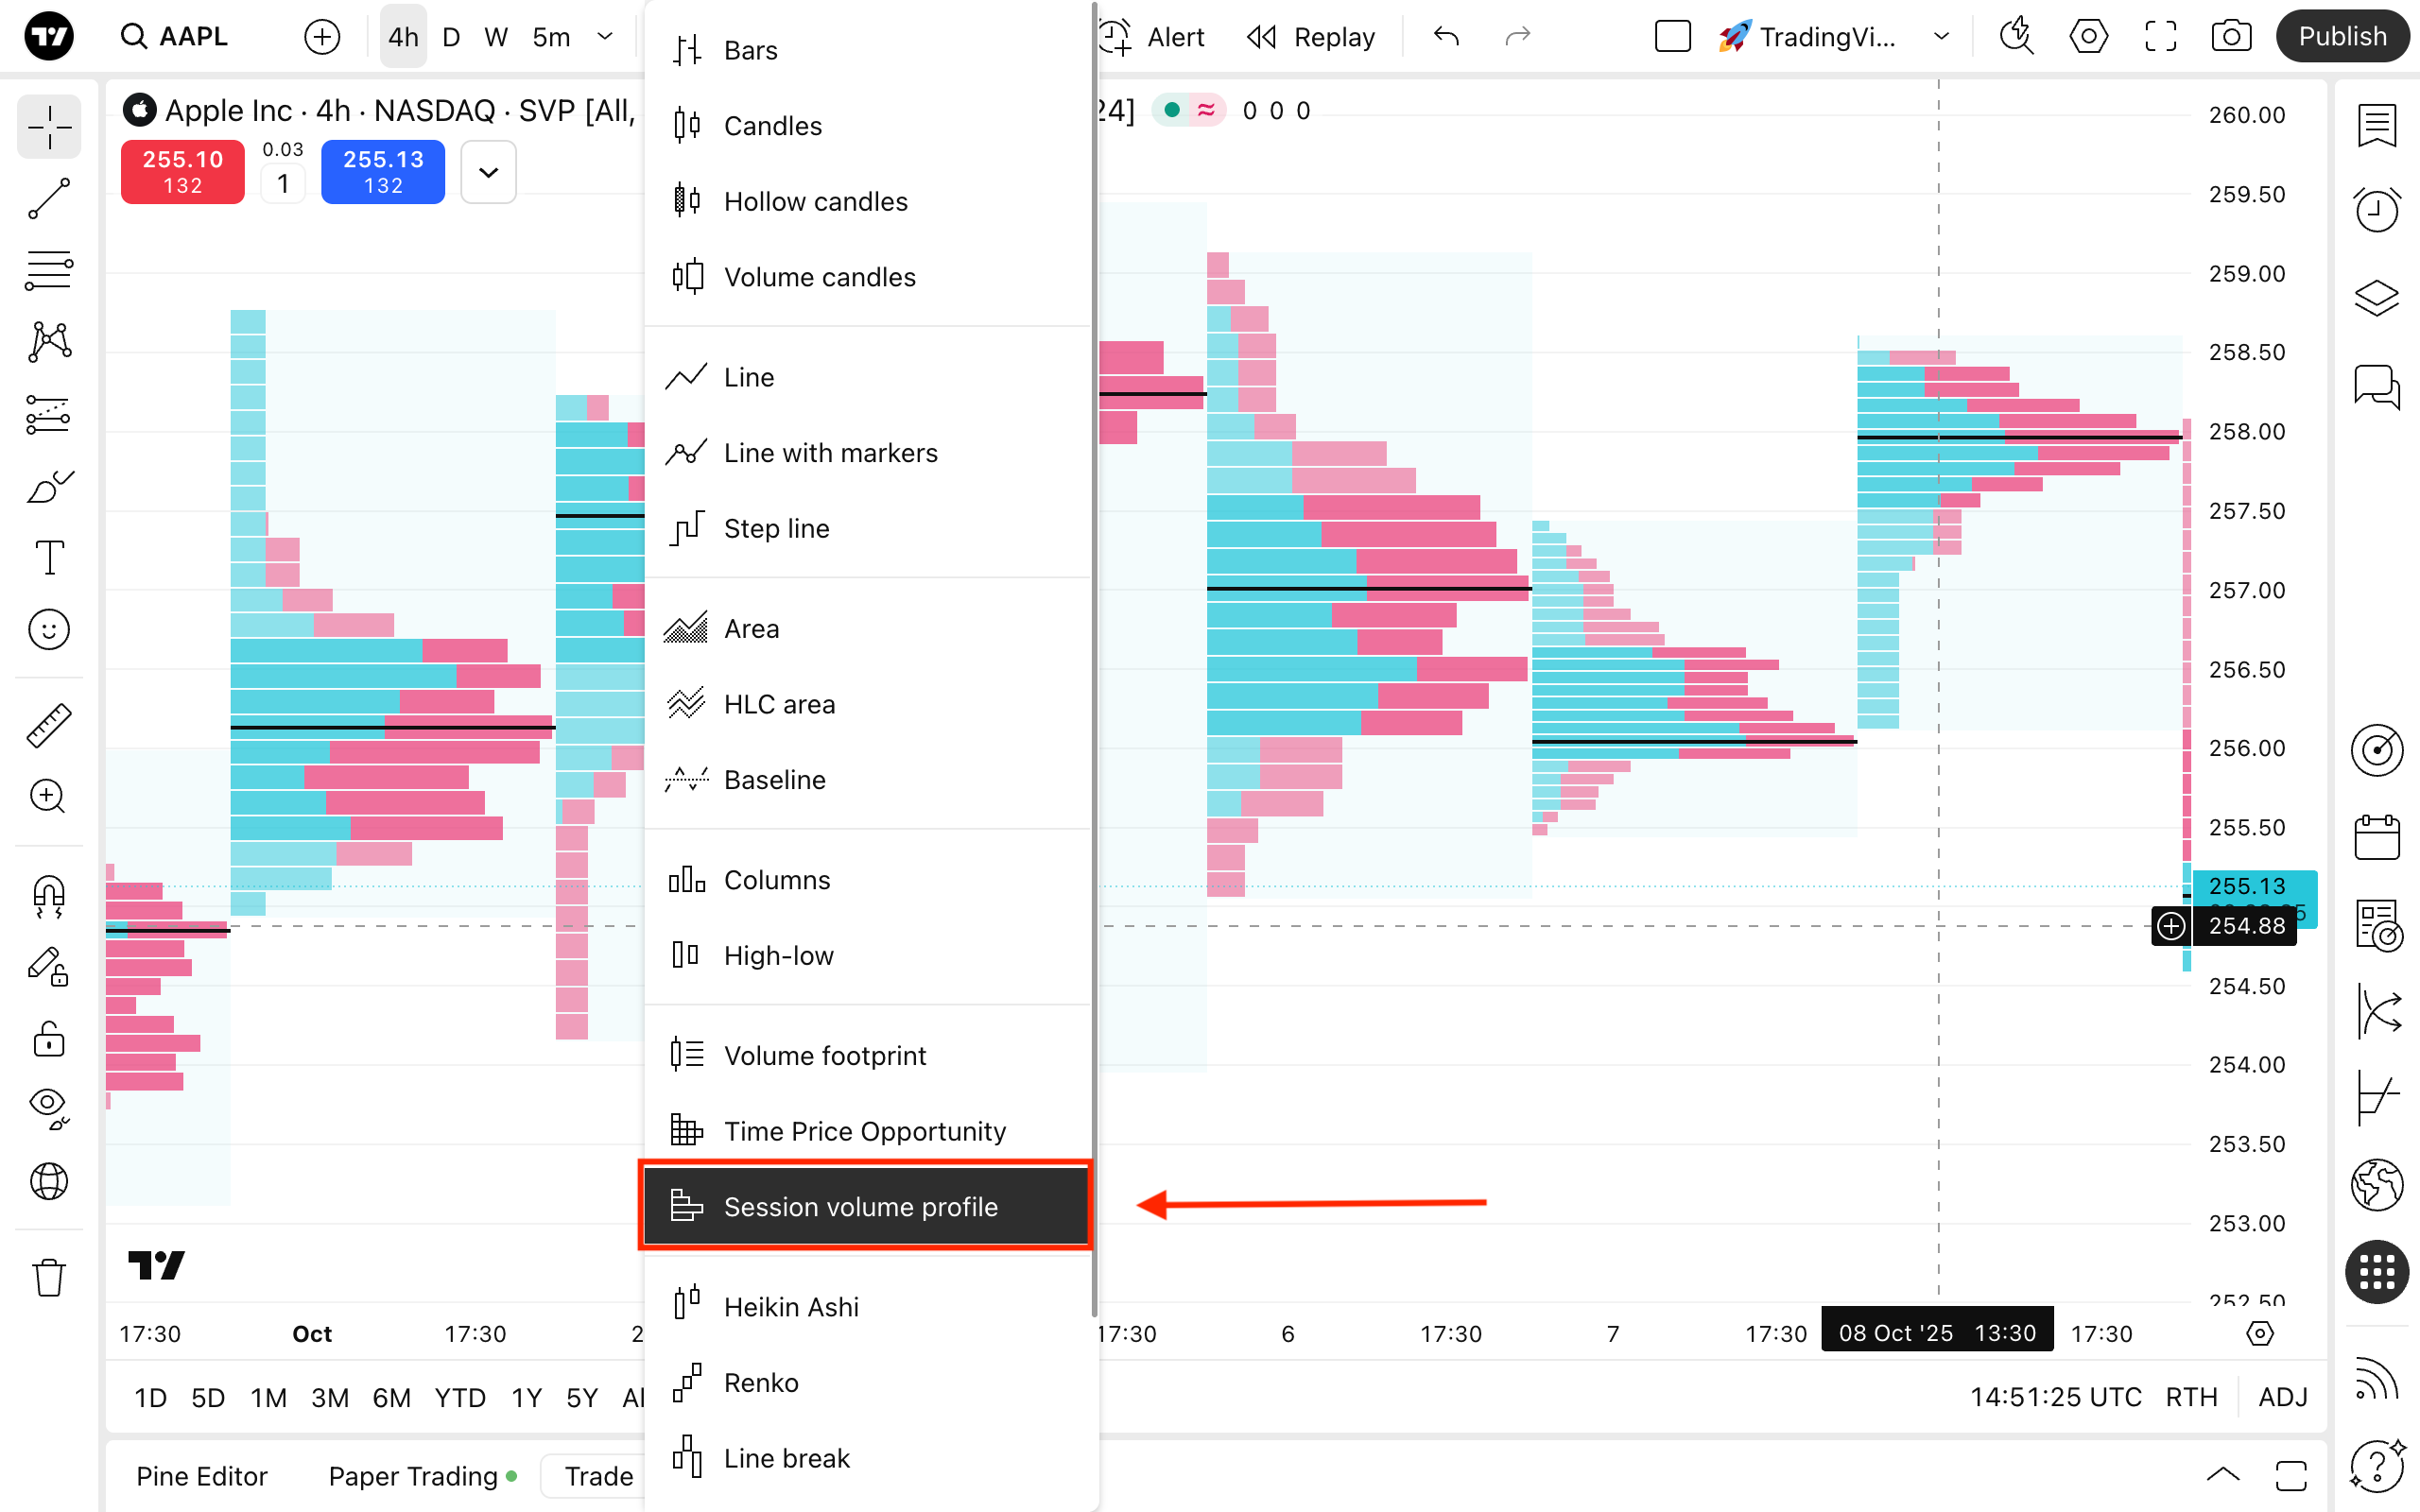
Draw three horizontal lines on the NinjaTrader chart with the Horizontal Line tool, one per level, and set each line's Attach to property to All charts, so the same line shows on the range chart, the tick chart and the SuperDOM without drawing it three times. Label them if your chart template shows labels; POC, VAH, VAL is enough. Delete yesterday's three before drawing today's, or the chart fills up with lines that no longer mean anything within a week.
Two things go wrong with this routine, and both are about which contract you are looking at.
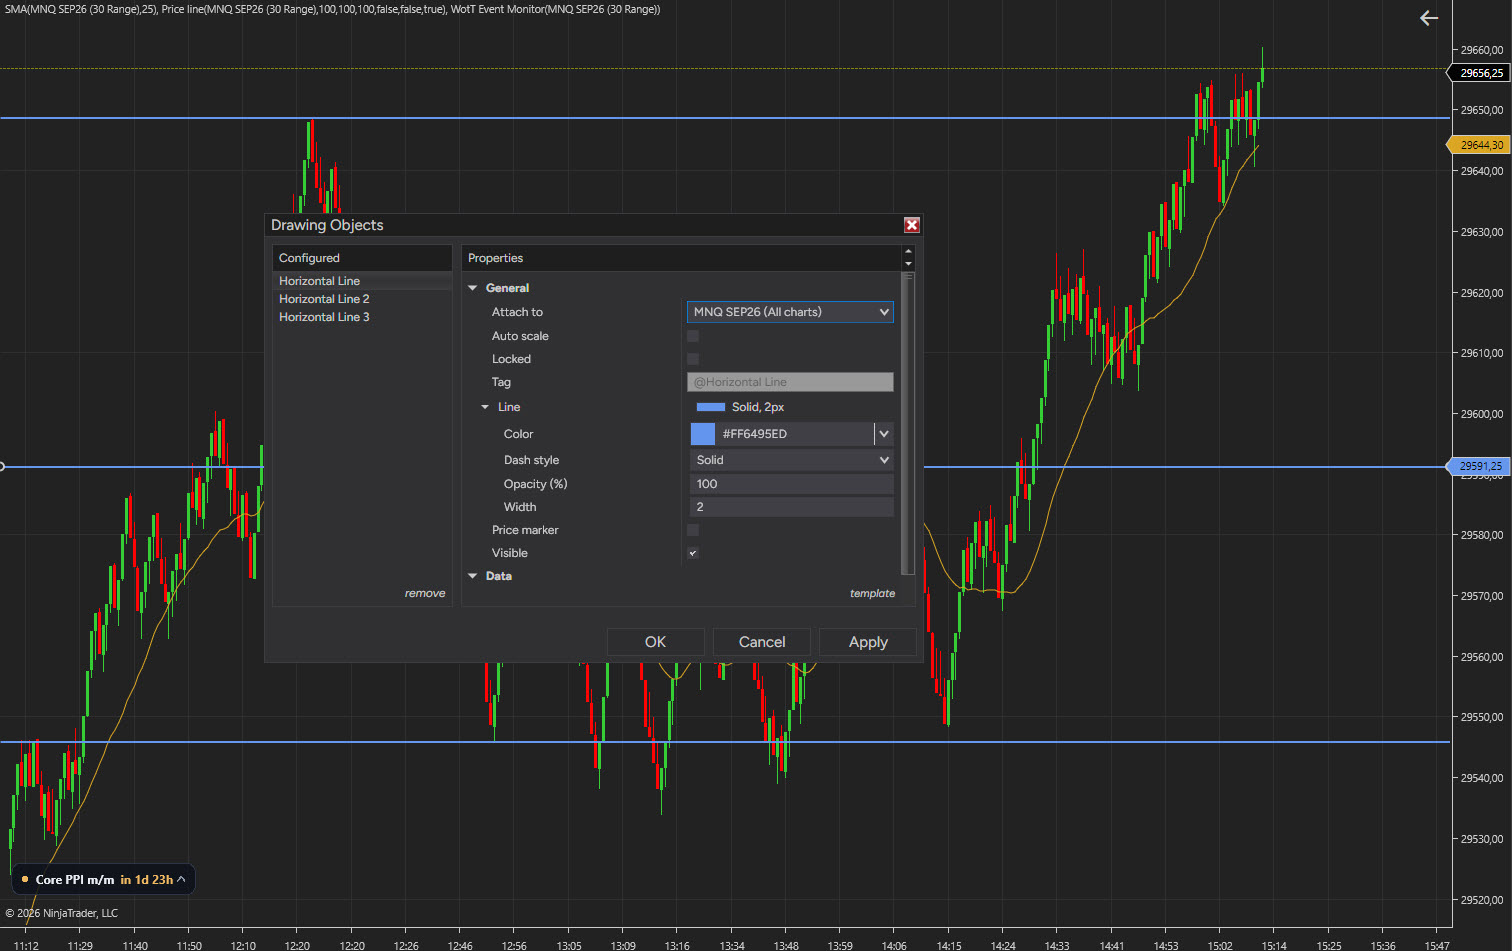
The first is the month. NQ1! on TradingView switches to the next contract on its own schedule around the quarterly roll, and the December contract trades at a different price from September's, often by tens of points. A POC read from the September profile is at the wrong price on the 12-26 chart. During roll week, use the explicit month symbol on TradingView and make sure it matches the contract in the NinjaTrader chart's Data Series.
The second is the session. A profile built on the full Globex day and one built on regular hours put the POC in different places on the same date. Whichever you choose, the NinjaTrader chart you draw the lines on should use the matching trading hours template, or the lines sit on a chart whose day started at a different time than the profile's.
When the add-on earns its price
The routine above gives you yesterday's levels. It does not give you today's developing profile, the POC migrating during the session, or a composite over the last ten days, and it doesn't give you the footprint and cumulative delta that ship in the same package. If those are part of how you read the tape, Order Flow+ is the honest purchase and the Lifetime license is the cheaper way to hold it over more than a year or two of trading. If the three morning numbers are what you use, the free route costs five minutes a day and nothing else.
My own profile comes from Order Flow+, which my prop login includes, so I mark POC, VAH and VAL in NinjaTrader before the European session; without that login, the route above is the one I'd use. Either way, marking them by hand is a first look at yesterday's shape, which is the part of the routine I would keep even if the lines drew themselves.
Educational content, not investment advice. Futures trading involves substantial risk of loss. Examples are for illustration only. Read the full Risk Disclosure.