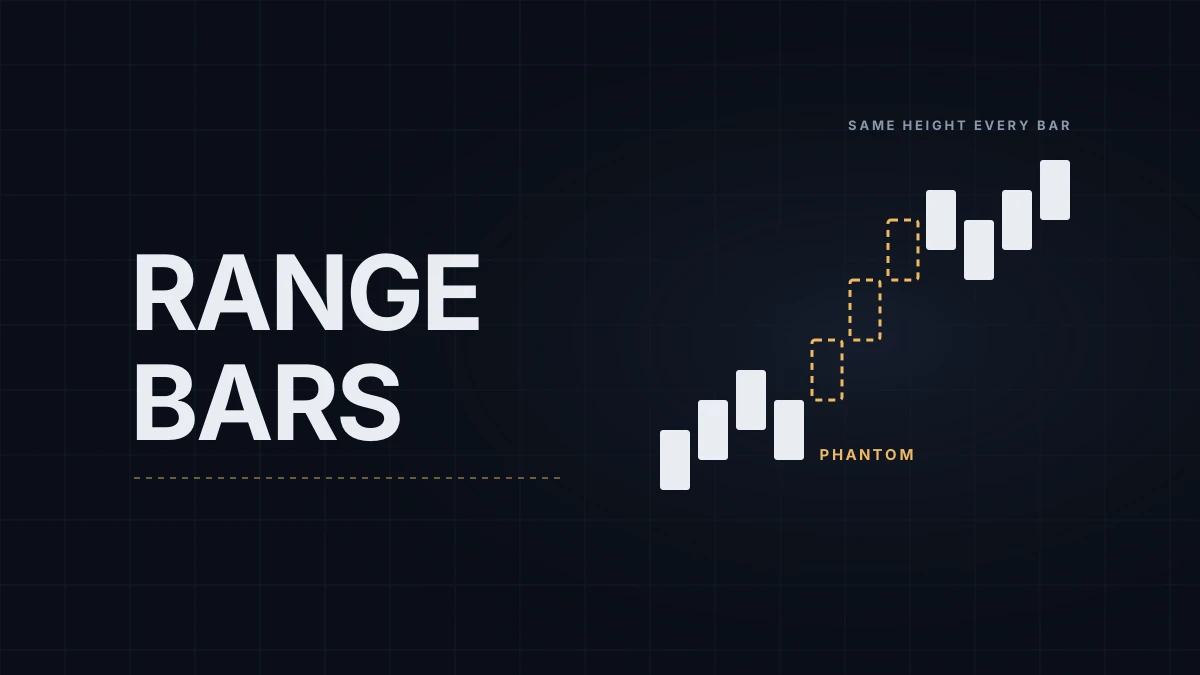
A range bar closes when price has covered a set number of ticks from the bar's low to its high, however long that takes. On NQ, where a tick is 0.25 points, a Range 30 bar spans 7.5 points. At lunch one of those bars can take twenty minutes; in the first minute after the open a dozen can print. The chart stops showing time and starts showing movement, which is why many order-flow and level traders use them. How range bars compare with time, tick and volume bars is covered in the chart timeframes and bar types post, and adding one to a chart is part of the NinjaTrader 8 chart setup guide.
I execute on a Range 30 chart and the strategy I'm automating runs on it, so the backtesting problems below are ones I run into, not theory.
How NinjaTrader builds a range bar
- Fixed height. When a bar completes, its high minus its low equals the range setting in ticks. A finished Range 30 bar is 30 ticks tall; only the last bar of a session can be shorter, when Break at EOD ends it early.
- The close is an extreme. The tick that completes the range ends the bar, so every finished bar closes at its high or its low.
- The open is the next trade. A new bar starts with the next tick that prints. Its open can sit a tick away from the previous close, and unlike some other platforms' range bars, NinjaTrader's don't force each open to equal the prior close.
- Gaps get filled. When price jumps further than the range in one go inside a session, as it can on a data release, NinjaTrader draws the distance as a series of complete bars. With Break at EOD on, a new session such as the Sunday reopen starts a fresh bar at its first trade instead, so that gap stays visible; with it off, it gets filled too. Traders on NinjaTrader's forum call them phantom bars: they sit at prices where no trade may have happened.
- Built from ticks. Range bars are assembled tick by tick, so an accurate history needs tick data. With the same ticks, historical bars match the ones you'd have seen in real time, but a single tick of difference between the live feed and the downloaded history can change every bar after it.
What backtests on range bars get wrong
1. The signal and the fill look a tick apart. A strategy that calculates on bar close sees a bar that just ended at its high and acts on the next bar. In the backtest, the entry lands right next to that close. Live, the signal arrives only after the move that completed the bar, and a market order fills wherever the next trades print, which in a fast market can be several ticks away. Range bars make the distance between signal and fill look like the smallest possible number.
2. Phantom bars trade prices that didn't trade. A stop or limit that sits inside a gap gets filled at a price inside one of the filler bars. On a big jump after a data release, or across the session break with Break at EOD off, this can produce entries and exits that were never available, and they tend to be large, because gaps are large.
3. Fills inside a bar are guessed. By default the Strategy Analyzer fills orders from each bar's open, high, low and close with assumptions about the path between them. With a stop and a target both inside one bar, it can't know which came first. Setting Order Fill Resolution to High with a 1-tick series fills orders against the actual tick sequence instead. One catch: High order fill resolution can't be combined with Tick Replay, so a strategy that needs Tick Replay has to add its own 1-tick series in code and submit its orders to that series.
4. Limit orders can fill on a touch. By default NinjaTrader's backtest fills a limit only once price trades through it, but with Fill limit orders on touch checked it fills as soon as price reaches the level. Live, you wait in a queue, and a price that touches your level and turns may leave you unfilled; the CME FIFO queue post explains why. With touch fills on, range bars put this bias exactly where many strategies trade: a bar that tags a level and reverses is the pattern a fade strategy looks for, and the touch fill is most optimistic right there.
None of this is specific to NinjaTrader. Any platform's range bars share the first problem, the fourth depends on the backtester's limit-fill rule, and the gap-filling rule depends on the platform's definition.
Testing a range bar strategy without fooling yourself
- Use High order fill resolution (1 tick) in the Strategy Analyzer, or a 1-tick series in code if the strategy depends on Tick Replay. The historical data and Tick Replay post covers downloading the tick history this needs.
- Add slippage for market and stop-market orders, at least a tick per side on NQ, more for strategies that trade the open or data releases.
- Flag trades around gaps. List every trade that entered or exited in the first bars after the session open or a data release and check them by hand. If removing them changes the result, the result was the gaps.
- Replay before you believe it. Run the same days in Market Replay, then on a simulation account in real time. Market Replay fills against recorded ticks, which removes most of the guessing about the path, though not the queue: NinjaTrader sets bid and ask size to 1 in playback, so replay limit orders fill close to a touch.
The Strategy Analyzer guide covers the settings, and the backtest vs live results post covers what tends to survive the move to real money. With range bars, expect the gap between the two to be wider than with time bars, because the bars themselves were drawn with hindsight about where each one ended.
Educational content, not investment advice. Futures trading involves substantial risk of loss. Examples are for illustration only. Read the full Risk Disclosure.