Historical vs Real-Time Data in NinjaTrader 8: Reload, Tick Replay and Why Bars Change After a Restart
A tick chart that looked one way at 10:15 AM ET looks different after a restart at 11:00, and nothing is broken. How NinjaTrader 8 builds bars from live ticks and from its historical servers, why the two disagree, what Reload All Historical Data and Tick Replay each fix, and what they cost.
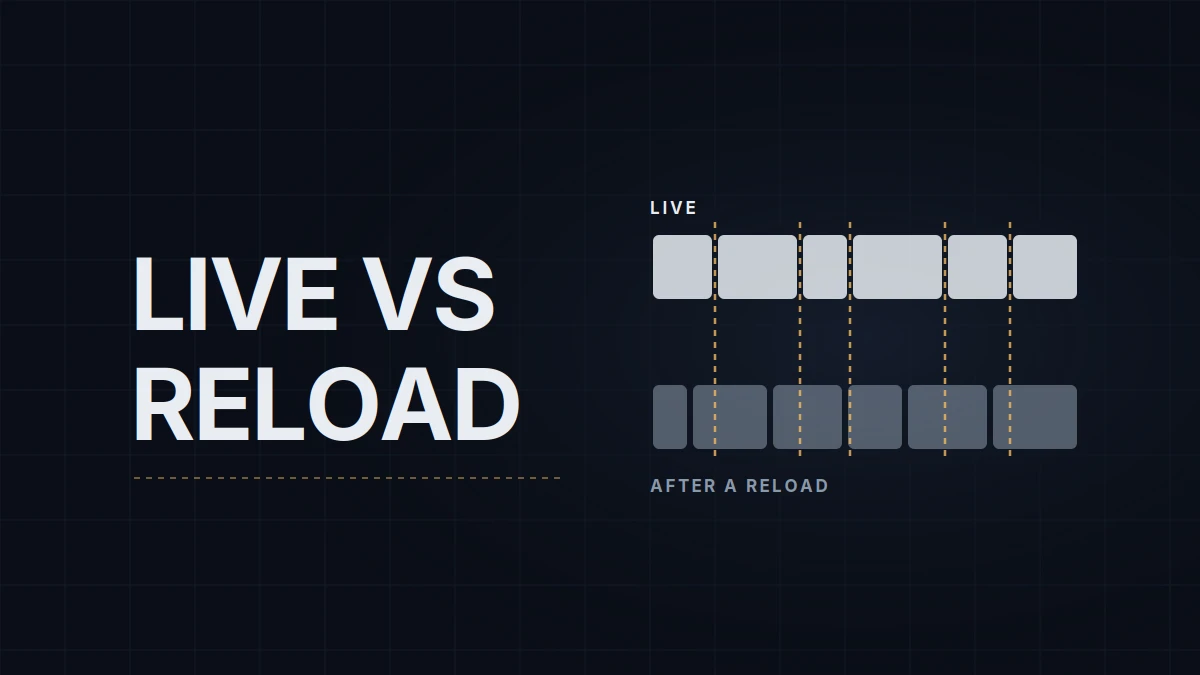
A 2,000-tick chart of the E-mini Nasdaq-100 (NQ) that looked one way at 10:15 AM ET (16:15 CEST) looks different after a restart at 11:00. The swing high that closed a bar at 10:02 now sits in the middle of one, and an indicator that crossed at 10:20 crosses a bar later. Nothing is broken. NinjaTrader 8 built the first version from ticks as they arrived and the second from data it downloaded, and the two don't have to match.
The chart settings involved, bar types, trading hours templates and Break at EOD among them, are set up in the NinjaTrader 8 chart setup. Below are where each version of the data comes from, the reasons they disagree, and the two tools NinjaTrader gives you for it: Reload All Historical Data and Tick Replay.
Two sources for the same bars
While a chart is open and connected, NinjaTrader builds its bars from the real-time ticks the connection sends and keeps them in a local cache. When the chart loads, reloads or reconnects after a disconnection, it requests historical data instead, and what it downloads replaces the cached live data. On Rithmic, on CQG-based connections and on the connection named NinjaTrader that Tradovate prop accounts use, that history comes from NinjaTrader's own historical data servers rather than from the live feed.
Which history gets downloaded depends on the bar type. Tick, volume, range, second and Renko bars are built from tick data, minute bars from minute data, and daily and longer bars from daily data. NinjaTrader's servers keep tick data for about a year, so a tick-based chart on those connections can't load further back than that, whatever the Data Series window asks for. Minute data goes back much further.
Why the two versions disagree
NinjaTrader's Help Guide is plain about the root of it: data vendors filter, throttle and timestamp ticks in different ways, and the platform has no way of knowing how a historical provider packaged its data. The specific causes behind a changed chart are fewer than the symptoms.
| Cause | What changes | What to do |
|---|---|---|
| The chart was opened or reloaded after the session started | History fills the chart up to the moment it opened, and a new live bar starts there; after a reload the whole session counts from its start, so every bar boundary after that moment shifts | Nothing is wrong; the reloaded version is the one you'll get again tomorrow |
| The live feed and the history servers package trades differently | Tick bars close at different trades, because a tick bar counts trades and one feed can split what another reports as one | Compare tick charts only within one data source; prop firm data feeds covers the difference |
| Ticks were missed during a disconnection | The live chart has a hole or an oversized bar; the download fills it | Reload once after any disconnection |
| Break at EOD is off, and the first day loaded moved (Days to load changed, or a day passed) | Tick and volume bars run across the session break, so where loading starts decides where every later bar ends | Keep Break at EOD on for tick-based charts you compare from day to day |
| The merge policy changed, or a rollover passed | Back-adjusted history shifts older prices by the gap at each rollover | Reload after changing the policy |
| A historical server is missing data | History shows holes or thin bars | Retry later; a reconnect can land on a different server |
The first cause catches the most people. A 2,000-tick bar ends wherever the 2,000th trade falls, counted from wherever the chart started counting, so a chart opened at 9:40 draws a different set of bars from one opened before the session, and a restart replaces the first set with the second. Range bars are less sensitive, since they close on price distance rather than on a count, but their starting point also moves with the first tick loaded.
The last cause is rare but documented. On January 30, 2025, NinjaTrader support confirmed that some of its historical data servers were missing data for most CME instruments, and added that users can't choose which server they reach.
Timestamps are a possible seventh, and they rarely apply to prop traders. Ticks that arrive without a timestamp get the PC's clock, and a drifting clock can put a tick in a different bar than history does; NinjaTrader, CQG and Rithmic stamp their own ticks.
Reload All Historical Data
Right-click the chart and choose Reload All Historical Data (Ctrl+Shift+R). NinjaTrader downloads the chart's base data again (tick data behind a tick chart, minute data behind a 5-minute chart), overwrites the locally stored copy and its cache, and reloads every open chart of the instrument. It needs a connection that provides historical data, and incoming ticks are missed while the reload runs, so it's a command for a quiet moment rather than the middle of a trade. A Market Analyzer reloads separately from charts.
Reload NinjaScript, F5 on a chart, is a different command. It reloads the indicators and strategies on the chart; when the bars themselves look wrong, it's the wrong button.
If a reload doesn't fix the chart, NinjaTrader support's usual next step is to close the platform, delete the cache folder in Documents\NinjaTrader 8\db and start again. Support has said nothing important is lost that way as long as the data provider can supply the history again, and the same goes for the tick, minute and day folders next to it. The replay folder is different: it holds Market Replay sessions that may no longer exist on any server.
Tick Replay
Without Tick Replay, indicators on historical bars calculate once per bar, at the close, whatever their Calculate setting says. Live, the same indicator set to On each tick or On price change updates inside the bar. An indicator that reacts intrabar can therefore look different on historical bars than it did live, even when the bars match. Tick Replay feeds historical bars to indicators and strategies one tick at a time, so they calculate as they would have live.
To turn it on, open Tools › Settings › Market data (the window was called Options before version 8.1.5) and check Show Tick Replay. A Tick Replay box then appears in the Data Series window; check it for the chart that needs it.
It has limits. Tick Replay replays trades only, each with the best bid and ask at the moment of that trade; the bid and ask changes in between aren't replayed. It needs historical tick data, so on NinjaTrader's servers it reaches back about a year. Renko and Line Break charts can't use it. It isn't designed for strategy backtests either: NinjaTrader says a backtest run with Tick Replay won't match the same strategy running live, and points to the High option of Order fill resolution in the Strategy Analyzer instead. It's also expensive: NinjaTrader's developer documentation warns that it can generate thousands of events per bar, and charts load noticeably slower with it on, so the fewer days a Tick Replay chart loads, the better.
The cost is worth paying for an indicator that classifies each trade against the bid and ask, such as a running delta, or anything else computed tick by tick. An indicator that calculates on the bar close gets nothing from it.
Keeping the two versions close
Most of the confusion goes away with a few habits. Open the workspace before the session starts, so live bars and history count from the same point. Reload once after any disconnection. Keep Break at EOD, the trading hours template and Days to load the same on charts you compare. And don't compare a tick chart with anyone else's until the data source, the bar type and those settings match. The MAE/MFE export post runs into the same gap between live and recorded data from the Trade Performance side.
My own review runs off the screen recording of the session rather than a reloaded chart, partly for this reason: the recording shows the bars I traded from, not the ones the server rebuilt afterwards.
Educational content, not investment advice. Futures trading involves substantial risk of loss. Examples are for illustration only. Read the full Risk Disclosure.