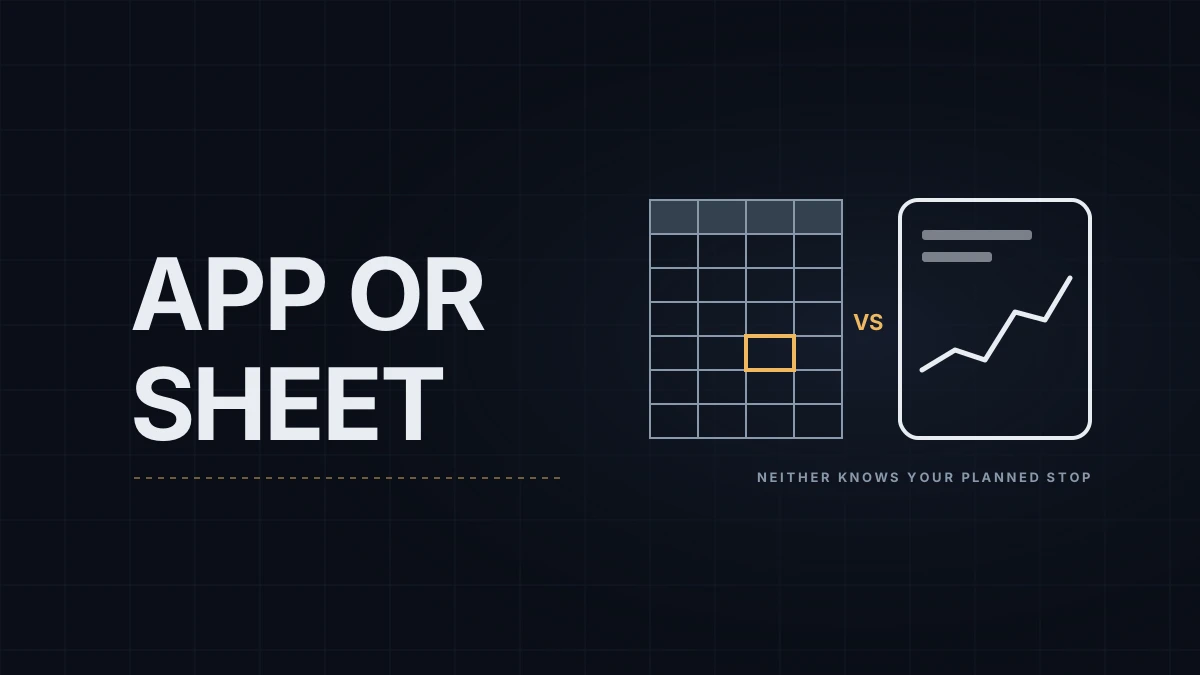
A spreadsheet costs nothing and does exactly what you build into it. A trading journal app costs roughly $15 to $100 a month at the time of writing, or about $200 a year on one well-known app's annual plan, and does a lot you didn't build: imports, charts with your executions on them, dozens of ready reports. Both can hold the fields from the trading journal template, and both run on the same raw material: the trade history NinjaTrader records as you trade from the charts built in the chart setup guide, exported as the NinjaTrader trade export guide explains. The question is which one you'll still be using in March.
What each does well
| Journal app | Spreadsheet | |
|---|---|---|
| Getting trades in | Broker connection or file import, often automatic | Paste or import the platform's CSV export |
| Charts with your entries and exits | Usually built in | Screenshots you take and link |
| Ready-made reports | Dozens: by hour, by weekday, by tag, streaks | Only the ones you write formulas for |
| Your own metrics | Limited to what the app offers | Anything you can express in a formula |
| Several accounts and brokers | Usually handled | Manual, one tab or one column per account |
| Cost | Monthly or yearly fee; free tiers often cap trades | Free |
| Your data | Exportable at most apps, check before committing | Already yours |
MAE and MFE deserve a separate check. The values NinjaTrader exports have been wrong on live accounts, as the MAE/MFE export post shows, and an app that imports NinjaTrader's Trades view inherits the problem. Some apps recompute them from their own price data; ask how before trusting the numbers.
The fields neither tool fills in
The hard part of a journal is the information only you have. The planned stop at entry, without which there is no R multiple, only dollars. The setup name and its grade. Why you skipped a valid signal, which the missed trades journal post argues a normal journal can't see. How you felt before the trade. An app makes those fields easier to enter and nicer to look at; it doesn't make you enter them. A trader who logs the planned stop on every trade in a spreadsheet will learn more than one who imports everything into an app and tags nothing.
The copier problem
If you run several prop accounts with a copier, one decision becomes five identical trades on five accounts. Many apps count them as five trades, which multiplies the trade count and the totals by the number of accounts and makes every statistic look backed by a sample it doesn't have, as if each copy were independent evidence. Check whether an app can group copied trades or filter to one account per decision. In a spreadsheet the fix is simple: analyze the leader account only and follow the other accounts' balances separately, which is what the prop account tracker is for.
Which to pick
Traders tend to land in one of three places:
- Spreadsheet only. A few trades a day, one platform, comfortable with formulas, and wanting metrics the apps don't offer. The cost is maintenance: you are the developer.
- App only. Many trades, several brokers or accounts, a preference for visual review. The cost is the fee and the app's idea of what matters.
- Both. An app for import and replay, with a periodic export into a spreadsheet or a script for the questions the app can't answer; the Python trade analysis post is one way to do that part.
Five checks before paying
- It imports from your platform or data feed without manual cleanup.
- It calculates R from a stop you enter, not only from dollars.
- It handles copied trades across accounts.
- It exports everything, notes and tags included, in a format you can open elsewhere.
- Its trading day matches the futures session, starting at 6:00 PM ET, so overnight trades land on the right day.
A free tier or trial with last month's trades answers all five in an evening.
Educational content, not investment advice. Futures trading involves substantial risk of loss. Examples are for illustration only. Read the full Risk Disclosure.